

BEUTEL GOODMAN MANAGED FUNDS
Annual Financial Report - Beutel, Goodman & Company Ltd.
Annual Financial Report - Beutel, Goodman & Company Ltd.

Create successful ePaper yourself
Turn your PDF publications into a flip-book with our unique Google optimized e-Paper software.
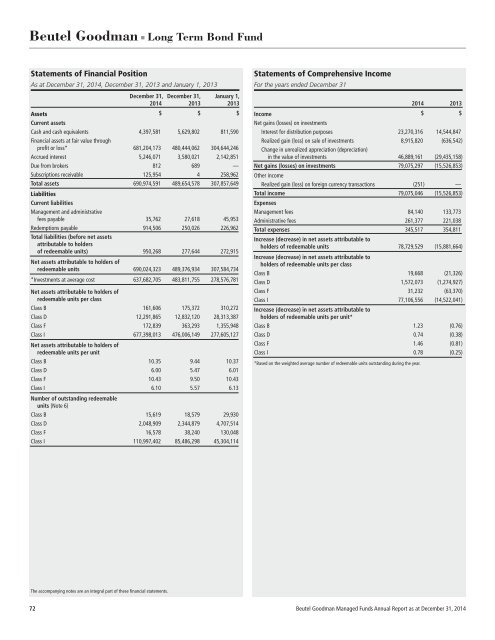
Beutel Goodman ■ Long Term Bond Fund<br />
Statements of Financial Position<br />
As at December 31, 2014, December 31, 2013 and January 1, 2013<br />
December 31, December 31, January 1,<br />
2014 2013 2013<br />
Assets<br />
$ $ $<br />
Current assets<br />
Cash and cash equivalents 4,397,581 5,629,802 811,590<br />
Financial assets at fair value through<br />
profit or loss* 681,204,173 480,444,062 304,644,246<br />
Accrued interest 5,246,071 3,580,021 2,142,851<br />
Due from brokers 812 689 —<br />
Subscriptions receivable 125,954 4 258,962<br />
Total assets 690,974,591 489,654,578 307,857,649<br />
Liabilities<br />
Current liabilities<br />
Management and administrative<br />
fees payable 35,762 27,618 45,953<br />
Redemptions payable 914,506 250,026 226,962<br />
Total liabilities (before net assets<br />
attributable to holders<br />
of redeemable units) 950,268 277,644 272,915<br />
Net assets attributable to holders of<br />
redeemable units 690,024,323 489,376,934 307,584,734<br />
*Investments at average cost 637,682,705 483,811,755 278,576,781<br />
Net assets attributable to holders of<br />
redeemable units per class<br />
Class B 161,606 175,372 310,272<br />
Class D 12,291,865 12,832,120 28,313,387<br />
Class F 172,839 363,293 1,355,948<br />
Class I 677,398,013 476,006,149 277,605,127<br />
Net assets attributable to holders of<br />
redeemable units per unit<br />
Class B 10.35 9.44 10.37<br />
Class D 6.00 5.47 6.01<br />
Class F 10.43 9.50 10.43<br />
Class I 6.10 5.57 6.13<br />
Number of outstanding redeemable<br />
units (Note 6)<br />
Class B 15,619 18,579 29,930<br />
Class D 2,048,909 2,344,879 4,707,514<br />
Class F 16,578 38,240 130,048<br />
Class I 110,997,402 85,486,298 45,304,114<br />
Statements of Comprehensive Income<br />
For the years ended December 31<br />
Income<br />
Net gains (losses) on investments<br />
2014 2013<br />
$ $<br />
Interest for distribution purposes 23,270,316 14,544,847<br />
Realized gain (loss) on sale of investments 8,915,820 (636,542)<br />
Change in unrealized appreciation (depreciation)<br />
in the value of investments 46,889,161 (29,435,158)<br />
Net gains (losses) on investments 79,075,297 (15,526,853)<br />
Other income<br />
Realized gain (loss) on foreign currency transactions (251) —<br />
Total income 79,075,046 (15,526,853)<br />
Expenses<br />
Management fees 84,140 133,773<br />
Administrative fees 261,377 221,038<br />
Total expenses 345,517 354,811<br />
Increase (decrease) in net assets attributable to<br />
holders of redeemable units 78,729,529 (15,881,664)<br />
Increase (decrease) in net assets attributable to<br />
holders of redeemable units per class<br />
Class B 19,668 (21,326)<br />
Class D 1,572,073 (1,274,927)<br />
Class F 31,232 (63,370)<br />
Class I 77,106,556 (14,522,041)<br />
Increase (decrease) in net assets attributable to<br />
holders of redeemable units per unit*<br />
Class B 1.23 (0.76)<br />
Class D 0.74 (0.38)<br />
Class F 1.46 (0.81)<br />
Class I 0.78 (0.25)<br />
*Based on the weighted average number of redeemable units outstanding during the year.<br />
The accompanying notes are an integral part of these financial statements.<br />
72 Beutel Goodman Managed Funds Annual Report as at December 31, 2014