

BEUTEL GOODMAN MANAGED FUNDS
Annual Financial Report - Beutel, Goodman & Company Ltd.
Annual Financial Report - Beutel, Goodman & Company Ltd.

Create successful ePaper yourself
Turn your PDF publications into a flip-book with our unique Google optimized e-Paper software.
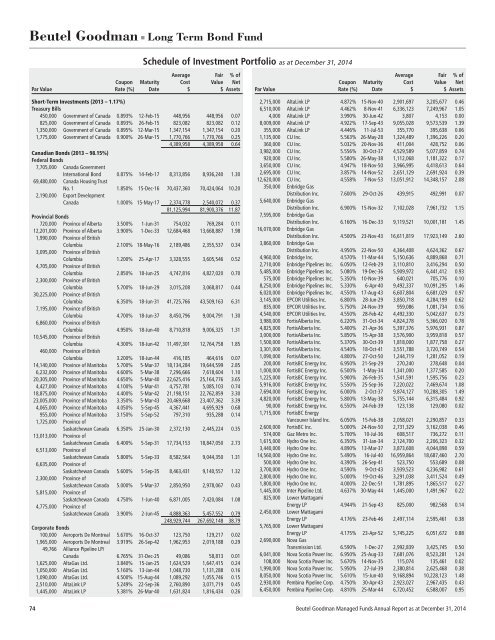
Beutel Goodman ■ Long Term Bond Fund<br />
Schedule of Investment Portfolio as at December 31, 2014<br />
Average Fair % of<br />
Coupon Maturity Cost Value Net<br />
Par Value Rate (%) Date $ $ Assets<br />
Short-Term Investments (2013 – 1.17%)<br />
Treasury Bills<br />
450,000 Government of Canada 0.893% 12-Feb-15 448,956 448,956 0.07<br />
825,000 Government of Canada 0.893% 26-Feb-15 823,082 823,082 0.12<br />
1,350,000 Government of Canada 0.895% 12-Mar-15 1,347,154 1,347,154 0.20<br />
1,775,000 Government of Canada 0.900% 26-Mar-15 1,770,766 1,770,766 0.25<br />
4,389,958 4,389,958 0.64<br />
Canadian Bonds (2013 – 98.15%)<br />
Federal Bonds<br />
7,705,000 Canada Government<br />
International Bond 0.875% 14-Feb-17 8,313,856 8,936,240 1.30<br />
69,480,000 Canada Housing Trust<br />
No. 1 1.850% 15-Dec-16 70,437,360 70,424,064 10.20<br />
2,190,000 Export Development<br />
Canada 1.000% 15-May-17 2,374,778 2,540,072 0.37<br />
81,125,994 81,900,376 11.87<br />
Provincial Bonds<br />
720,000 Province of Alberta 3.500% 1-Jun-31 754,032 769,284 0.11<br />
12,201,000 Province of Alberta 3.900% 1-Dec-33 12,684,468 13,668,887 1.98<br />
1,990,000 Province of British<br />
Columbia 2.100% 18-May-16 2,189,486 2,355,537 0.34<br />
3,095,000 Province of British<br />
Columbia 1.200% 25-Apr-17 3,328,555 3,605,546 0.52<br />
4,705,000 Province of British<br />
Columbia 2.850% 18-Jun-25 4,747,816 4,827,020 0.70<br />
2,300,000 Province of British<br />
Columbia 5.700% 18-Jun-29 3,015,208 3,068,817 0.44<br />
30,225,000 Province of British<br />
Columbia 6.350% 18-Jun-31 41,725,766 43,509,163 6.31<br />
7,195,000 Province of British<br />
Columbia 4.700% 18-Jun-37 8,450,796 9,004,791 1.30<br />
6,860,000 Province of British<br />
Columbia 4.950% 18-Jun-40 8,710,818 9,006,325 1.31<br />
10,545,000 Province of British<br />
Columbia 4.300% 18-Jun-42 11,497,301 12,764,758 1.85<br />
460,000 Province of British<br />
Columbia 3.200% 18-Jun-44 416,185 464,616 0.07<br />
14,140,000 Province of Manitoba 5.700% 5-Mar-37 18,134,284 19,644,599 2.85<br />
6,232,000 Province of Manitoba 4.600% 5-Mar-38 7,296,666 7,618,604 1.10<br />
20,305,000 Province of Manitoba 4.650% 5-Mar-40 22,625,416 25,164,776 3.65<br />
4,427,000 Province of Manitoba 4.100% 5-Mar-41 4,757,781 5,085,103 0.74<br />
18,875,000 Province of Manitoba 4.400% 5-Mar-42 21,198,151 22,762,859 3.30<br />
23,005,000 Province of Manitoba 3.350% 5-Mar-43 20,469,668 23,407,362 3.39<br />
4,065,000 Province of Manitoba 4.050% 5-Sep-45 4,367,441 4,695,929 0.68<br />
955,000 Province of Manitoba 3.150% 5-Sep-52 797,310 935,288 0.14<br />
1,725,000 Province of<br />
Saskatchewan Canada 6.350% 25-Jan-30 2,372,130 2,445,224 0.35<br />
13,013,000 Province of<br />
Saskatchewan Canada 6.400% 5-Sep-31 17,734,153 18,847,050 2.73<br />
6,513,000 Province of<br />
Saskatchewan Canada 5.800% 5-Sep-33 8,582,564 9,044,350 1.31<br />
6,635,000 Province of<br />
Saskatchewan Canada 5.600% 5-Sep-35 8,463,431 9,140,557 1.32<br />
2,300,000 Province of<br />
Saskatchewan Canada 5.000% 5-Mar-37 2,850,950 2,978,067 0.43<br />
5,815,000 Province of<br />
Saskatchewan Canada 4.750% 1-Jun-40 6,871,005 7,420,084 1.08<br />
4,775,000 Province of<br />
Saskatchewan Canada 3.900% 2-Jun-45 4,888,363 5,457,552 0.79<br />
248,929,744 267,692,148 38.79<br />
Corporate Bonds<br />
100,000 Aeroports De Montreal 5.670% 16-Oct-37 123,750 129,217 0.02<br />
1,965,000 Aeroports De Montreal 3.919% 26-Sep-42 1,962,953 2,019,188 0.29<br />
49,766 Alliance Pipeline LP/<br />
Canada 6.765% 31-Dec-25 49,086 58,813 0.01<br />
1,625,000 AltaGas Ltd. 3.840% 15-Jan-25 1,624,529 1,647,415 0.24<br />
1,050,000 AltaGas Ltd. 5.160% 13-Jan-44 1,048,730 1,131,288 0.16<br />
1,090,000 AltaGas Ltd. 4.500% 15-Aug-44 1,089,292 1,055,746 0.15<br />
2,510,000 AltaLink LP 5.249% 22-Sep-36 2,760,890 3,071,719 0.45<br />
1,445,000 AltaLink LP 5.381% 26-Mar-40 1,631,824 1,816,434 0.26<br />
Average Fair % of<br />
Coupon Maturity Cost Value Net<br />
Par Value Rate (%) Date $ $ Assets<br />
2,715,000 AltaLink LP 4.872% 15-Nov-40 2,901,697 3,205,677 0.46<br />
6,510,000 AltaLink LP 4.462% 8-Nov-41 6,336,123 7,249,967 1.05<br />
4,000 AltaLink LP 3.990% 30-Jun-42 3,807 4,153 0.00<br />
8,009,000 AltaLink LP 4.922% 17-Sep-43 9,055,028 9,573,539 1.39<br />
355,000 AltaLink LP 4.446% 11-Jul-53 355,770 395,638 0.06<br />
1,135,000 CU Inc. 5.563% 26-May-28 1,324,489 1,396,226 0.20<br />
360,000 CU Inc. 5.032% 20-Nov-36 411,004 428,752 0.06<br />
3,982,000 CU Inc. 5.556% 30-Oct-37 4,529,589 5,077,859 0.74<br />
920,000 CU Inc. 5.580% 26-May-38 1,112,068 1,181,322 0.17<br />
3,650,000 CU Inc. 4.947% 18-Nov-50 3,966,995 4,418,613 0.64<br />
2,695,000 CU Inc. 3.857% 14-Nov-52 2,651,129 2,691,924 0.39<br />
12,620,000 CU Inc. 4.558% 7-Nov-53 13,051,912 14,348,157 2.08<br />
350,000 Enbridge Gas<br />
Distribution Inc. 7.600% 29-Oct-26 439,915 492,991 0.07<br />
5,640,000 Enbridge Gas<br />
Distribution Inc. 6.900% 15-Nov-32 7,102,028 7,961,732 1.15<br />
7,595,000 Enbridge Gas<br />
Distribution Inc. 6.160% 16-Dec-33 9,119,521 10,001,181 1.45<br />
16,070,000 Enbridge Gas<br />
Distribution Inc. 4.500% 23-Nov-43 16,611,819 17,923,149 2.60<br />
3,860,000 Enbridge Gas<br />
Distribution Inc. 4.950% 22-Nov-50 4,364,408 4,624,362 0.67<br />
4,960,000 Enbridge Inc. 4.570% 11-Mar-44 5,150,636 4,889,868 0.71<br />
2,710,000 Enbridge Pipelines Inc. 6.050% 12-Feb-29 3,110,810 3,416,294 0.50<br />
5,485,000 Enbridge Pipelines Inc. 5.080% 19-Dec-36 5,909,972 6,441,412 0.93<br />
575,000 Enbridge Pipelines Inc. 5.350% 10-Nov-39 640,021 705,776 0.10<br />
8,250,000 Enbridge Pipelines Inc. 5.330% 6-Apr-40 9,492,337 10,091,295 1.46<br />
6,020,000 Enbridge Pipelines Inc. 4.550% 17-Aug-43 6,607,804 6,681,029 0.97<br />
3,145,000 EPCOR Utilities Inc. 6.800% 28-Jun-29 3,850,718 4,284,199 0.62<br />
835,000 EPCOR Utilities Inc. 5.750% 24-Nov-39 959,086 1,081,734 0.16<br />
4,540,000 EPCOR Utilities Inc. 4.550% 28-Feb-42 4,492,330 5,042,637 0.73<br />
3,980,000 FortisAlberta Inc. 6.220% 31-Oct-34 4,824,278 5,366,020 0.78<br />
4,825,000 FortisAlberta Inc. 5.400% 21-Apr-36 5,397,376 5,976,931 0.87<br />
3,000,000 FortisAlberta Inc. 5.850% 15-Apr-38 3,576,900 3,959,818 0.57<br />
1,500,000 FortisAlberta Inc. 5.370% 30-Oct-39 1,818,000 1,877,758 0.27<br />
3,301,000 FortisAlberta Inc. 4.540% 18-Oct-41 3,551,788 3,720,749 0.54<br />
1,090,000 FortisAlberta Inc. 4.800% 27-Oct-50 1,244,719 1,281,052 0.19<br />
200,000 FortisBC Energy Inc. 6.950% 21-Sep-29 270,240 278,648 0.04<br />
1,000,000 FortisBC Energy Inc. 6.500% 1-May-34 1,341,000 1,377,585 0.20<br />
1,225,000 FortisBC Energy Inc. 5.900% 26-Feb-35 1,541,591 1,595,756 0.23<br />
5,916,000 FortisBC Energy Inc. 5.550% 25-Sep-36 7,220,022 7,469,674 1.08<br />
7,694,000 FortisBC Energy Inc. 6.000% 2-Oct-37 9,874,127 10,288,305 1.49<br />
4,820,000 FortisBC Energy Inc. 5.800% 13-May-38 5,755,144 6,315,484 0.92<br />
90,000 FortisBC Energy Inc. 6.550% 24-Feb-39 123,138 129,080 0.02<br />
1,715,000 FortisBC Energy<br />
Vancouver Island Inc. 6.050% 15-Feb-38 2,058,021 2,290,857 0.33<br />
2,600,000 FortisBC Inc. 5.000% 24-Nov-50 2,731,329 3,162,038 0.46<br />
574,000 Gaz Metro Inc. 5.700% 10-Jul-36 608,517 736,272 0.11<br />
1,615,000 Hydro One Inc. 6.350% 31-Jan-34 2,124,700 2,206,323 0.32<br />
3,440,000 Hydro One Inc. 4.890% 13-Mar-37 3,873,608 4,044,898 0.59<br />
14,560,000 Hydro One Inc. 5.490% 16-Jul-40 16,959,864 18,687,460 2.70<br />
500,000 Hydro One Inc. 4.390% 26-Sep-41 523,750 553,689 0.08<br />
3,700,000 Hydro One Inc. 4.590% 9-Oct-43 3,939,523 4,236,982 0.61<br />
2,800,000 Hydro One Inc. 5.000% 19-Oct-46 3,291,038 3,411,524 0.49<br />
1,800,000 Hydro One Inc. 4.000% 22-Dec-51 1,781,895 1,865,517 0.27<br />
1,445,000 Inter Pipeline Ltd. 4.637% 30-May-44 1,445,000 1,491,967 0.22<br />
825,000 Lower Mattagami<br />
Energy LP 4.944% 21-Sep-43 825,000 982,568 0.14<br />
2,450,000 Lower Mattagami<br />
Energy LP 4.176% 23-Feb-46 2,497,114 2,595,461 0.38<br />
5,765,000 Lower Mattagami<br />
Energy LP 4.175% 23-Apr-52 5,745,225 6,051,672 0.88<br />
2,690,000 Nova Gas<br />
Transmission Ltd. 6.590% 1-Dec-27 2,992,839 3,425,745 0.50<br />
6,041,000 Nova Scotia Power Inc. 6.950% 25-Aug-33 7,681,076 8,523,281 1.24<br />
108,000 Nova Scotia Power Inc. 5.670% 14-Nov-35 115,074 135,461 0.02<br />
1,990,000 Nova Scotia Power Inc. 5.950% 27-Jul-39 2,380,814 2,625,468 0.38<br />
8,050,000 Nova Scotia Power Inc. 5.610% 15-Jun-40 9,168,894 10,228,123 1.48<br />
2,930,000 Pembina Pipeline Corp. 4.750% 30-Apr-43 2,923,027 2,967,435 0.43<br />
6,450,000 Pembina Pipeline Corp. 4.810% 25-Mar-44 6,720,452 6,588,007 0.95<br />
74 Beutel Goodman Managed Funds Annual Report as at December 31, 2014