Table 13a. Freddie Mac Total MBS Outstanding Detail a End of Period Fixed-Rate b ($) Single-Family Mortgages ($ in Millions) Adjustable- Rate c ($) Conventional Seconds d ($) Total ($) Total FHA/VA d Conventional ($) Multifamily Mortgages ($ in Millions) FHA/RD ($) Multifamily Mortgages ($) ($ in Millions) Total MBS Outstanding e ($) Multiclass MBS Outstanding f ($) 4Q15 1,409,898 68,234 0 1,478,132 2,413 114,130 0 114,130 1,594,675 411,016 3Q15 1,391,129 67,678 0 1,458,807 2,183 103,185 0 103,185 1,564,175 406,576 2Q15 1,370,345 70,181 0 1,440,526 2,598 98,320 0 98,320 1,541,444 411,368 1Q15 1,343,481 71,662 0 1,415,143 2,742 91,225 0 91,225 1,509,110 408,366 Annual Data 2015 1,409,898 68,234 0 1,478,132 2,413 114,130 0 114,130 1,594,675 411,016 2014 1,338,926 72,095 0 1,411,021 2,835 87,836 0 87,836 1,501,692 410,133 2013 1,306,504 72,187 1 1,378,692 3,152 71,793 0 71,793 1,453,637 402,309 2012 1,269,642 76,095 1 1,345,738 3,452 49,542 0 49,542 1,398,732 427,630 2011 1,303,916 81,977 2 1,385,895 4,106 32,080 0 32,080 1,422,081 451,716 2010 1,357,124 84,471 2 1,441,597 4,434 21,954 0 21,954 1,467,985 429,115 2009 1,364,796 111,550 3 1,476,349 3,544 15,374 0 15,374 1,495,267 448,329 2008 1,242,648 142,495 4 1,385,147 3,970 13,597 0 13,597 1,402,714 517,654 2007 1,206,495 161,963 7 1,368,465 4,499 8,899 0 8,899 1,381,863 526,604 2006 967,580 141,740 12 1,109,332 5,396 8,033 0 8,033 1,122,761 491,696 2005 836,023 117,757 19 953,799 6,289 14,112 0 14,112 974,200 437,668 2004 736,332 91,474 70 827,876 9,254 15,140 0 15,140 852,270 390,516 2003 649,699 74,409 140 724,248 12,157 15,759 0 15,759 752,164 347,833 2002 647,603 61,110 5 708,718 12,361 8,730 0 8,730 729,809 392,545 2001 609,290 22,525 10 631,825 14,127 7,132 0 7,132 653,084 299,652 2000 533,331 36,266 18 569,615 778 5,708 0 5,708 576,101 309,185 1999 499,671 33,094 29 532,794 627 4,462 0 4,462 537,883 316,168 Not Available Not Available Not Available Not Available Not Available Not Available Not Available Not Available 1998 Before 1999 Before 1999 Before 1999 Before 1999 Before 1999 Before 1999 Before 1999 Before 1999 478,351 260,504 1997 475,985 233,829 1996 473,065 237,939 1995 459,045 246,336 1994 460,656 264,152 1993 439,029 265,178 1992 407,514 218,747 1991 359,163 146,978 1990 316,359 88,124 1989 272,870 52,865 1988 226,406 15,621 1987 212,635 3,652 1986 169,186 5,333 1985 99,909 5,047 1984 70,026 3,214 1983 57,720 1,669 1982 42,952 Not Issued Before 1983 1981 19,897 1980 16,962 1979 15,316 1978 12,017 1977 6,765 1976 2,765 1975 1,643 1974 780 1973 791 1972 444 1971 64 Source: Freddie Mac a Based on unpaid principal balances of mortgage guarantees held by third parties. Excludes mortgagebacked securities (MBS) held for investment by Freddie Mac and unguaranteed subordinated whole loan securities. b Includes U.S.Department of Agriculture Rural Development (RD) loan programs. c From 2001 to the current period, includes MBS with underlying mortgages classified as balloon/reset loans. Freddie Mac discontinued purchase of balloon/reset mortgages on January 1, 2013. d From 2002 to the current period, includes resecuritizations of non-Freddie Mac securities. e Excludes mortgage loans and mortgage-related securities traded but not yet settled. From 2002 to the current period, amounts include real estate mortgage investment conduits and other structured securities, other guarantee transactions, and other guarantee commitments of mortgage loans and MBS held by third parties. f Amounts are included in total MBS outstanding column. 102 FEDERAL HOUSING FINANCE AGENCY
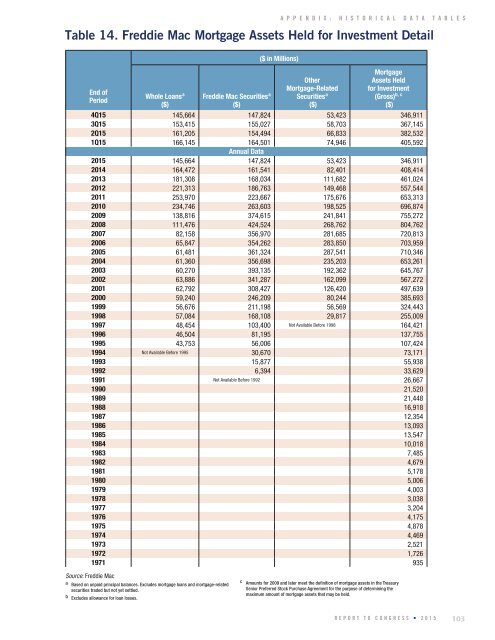
A P P E N D I X : H I S T O R I C A L D A T A T A B L E S Table 14. Freddie Mac Mortgage Assets Held for Investment Detail End of Period Whole Loans a ($) Freddie Mac Securities a ($) ($ in Millions) Other Mortgage-Related Securities a ($) Mortgage Assets Held for Investment (Gross) b, c ($) 4Q15 145,664 147,824 53,423 346,911 3Q15 153,415 155,027 58,703 367,145 2Q15 161,205 154,494 66,833 382,532 1Q15 166,145 164,501 74,946 405,592 Annual Data 2015 145,664 147,824 53,423 346,911 2014 164,472 161,541 82,401 408,414 2013 181,308 168,034 111,682 461,024 2012 221,313 186,763 149,468 557,544 2011 253,970 223,667 175,676 653,313 2010 234,746 263,603 198,525 696,874 2009 138,816 374,615 241,841 755,272 2008 111,476 424,524 268,762 804,762 2007 82,158 356,970 281,685 720,813 2006 65,847 354,262 283,850 703,959 2005 61,481 361,324 287,541 710,346 2004 61,360 356,698 235,203 653,261 2003 60,270 393,135 192,362 645,767 2002 63,886 341,287 162,099 567,272 2001 62,792 308,427 126,420 497,639 2000 59,240 246,209 80,244 385,693 1999 56,676 211,198 56,569 324,443 1998 57,084 168,108 29,817 255,009 1997 48,454 103,400 Not Available Before 1998 164,421 1996 46,504 81,195 137,755 1995 43,753 56,006 107,424 1994 Not Available Before 1995 30,670 73,171 1993 15,877 55,938 1992 6,394 33,629 1991 Not Available Before 1992 26,667 1990 21,520 1989 21,448 1988 16,918 1987 12,354 1986 13,093 1985 13,547 1984 10,018 1983 7,485 1982 4,679 1981 5,178 1980 5,006 1979 4,003 1978 3,038 1977 3,204 1976 4,175 1975 4,878 1974 4,469 1973 2,521 1972 1,726 1971 935 Source: Freddie Mac a Based on unpaid principal balances. Excludes mortgage loans and mortgage-related securities traded but not yet settled. b Excludes allowance for loan losses. c Amounts for 2009 and later meet the definition of mortgage assets in the Treasury Senior Preferred Stock Purchase Agreement for the purpose of determining the maximum amount of mortgage assets that may be held. REPORT TO <strong>CONGRESS</strong> • 2015 103