

CONGRESS
FHFA_2015_Report-to-Congress
FHFA_2015_Report-to-Congress

Create successful ePaper yourself
Turn your PDF publications into a flip-book with our unique Google optimized e-Paper software.
A P P E N D I X : H I S T O R I C A L D A T A T A B L E S<br />
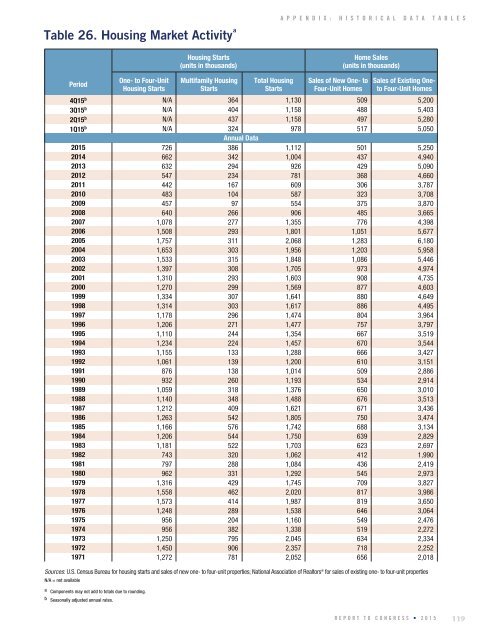
Table 26. Housing Market Activity a<br />
Housing Starts<br />
(units in thousands)<br />
Home Sales<br />
(units in thousands)<br />
Period<br />
One- to Four-Unit<br />
Housing Starts<br />
Multifamily Housing<br />
Starts<br />
Total Housing<br />
Starts<br />
Sales of New One- to<br />
Four-Unit Homes<br />
Sales of Existing Oneto<br />
Four-Unit Homes<br />
4Q15 b N/A 364 1,130 509 5,200<br />
3Q15 b N/A 404 1,158 488 5,403<br />
2Q15 b N/A 437 1,158 497 5,280<br />
1Q15 b N/A 324 978 517 5,050<br />
Annual Data<br />
2015 726 386 1,112 501 5,250<br />
2014 662 342 1,004 437 4,940<br />
2013 632 294 926 429 5,090<br />
2012 547 234 781 368 4,660<br />
2011 442 167 609 306 3,787<br />
2010 483 104 587 323 3,708<br />
2009 457 97 554 375 3,870<br />
2008 640 266 906 485 3,665<br />
2007 1,078 277 1,355 776 4,398<br />
2006 1,508 293 1,801 1,051 5,677<br />
2005 1,757 311 2,068 1,283 6,180<br />
2004 1,653 303 1,956 1,203 5,958<br />
2003 1,533 315 1,848 1,086 5,446<br />
2002 1,397 308 1,705 973 4,974<br />
2001 1,310 293 1,603 908 4,735<br />
2000 1,270 299 1,569 877 4,603<br />
1999 1,334 307 1,641 880 4,649<br />
1998 1,314 303 1,617 886 4,495<br />
1997 1,178 296 1,474 804 3,964<br />
1996 1,206 271 1,477 757 3,797<br />
1995 1,110 244 1,354 667 3,519<br />
1994 1,234 224 1,457 670 3,544<br />
1993 1,155 133 1,288 666 3,427<br />
1992 1,061 139 1,200 610 3,151<br />
1991 876 138 1,014 509 2,886<br />
1990 932 260 1,193 534 2,914<br />
1989 1,059 318 1,376 650 3,010<br />
1988 1,140 348 1,488 676 3,513<br />
1987 1,212 409 1,621 671 3,436<br />
1986 1,263 542 1,805 750 3,474<br />
1985 1,166 576 1,742 688 3,134<br />
1984 1,206 544 1,750 639 2,829<br />
1983 1,181 522 1,703 623 2,697<br />
1982 743 320 1,062 412 1,990<br />
1981 797 288 1,084 436 2,419<br />
1980 962 331 1,292 545 2,973<br />
1979 1,316 429 1,745 709 3,827<br />
1978 1,558 462 2,020 817 3,986<br />
1977 1,573 414 1,987 819 3,650<br />
1976 1,248 289 1,538 646 3,064<br />
1975 956 204 1,160 549 2,476<br />
1974 956 382 1,338 519 2,272<br />
1973 1,250 795 2,045 634 2,334<br />
1972 1,450 906 2,357 718 2,252<br />
1971 1,272 781 2,052 656 2,018<br />
Sources: U.S. Census Bureau for housing starts and sales of new one- to four-unit properties; National Association of Realtors ® for sales of existing one- to four-unit properties<br />
N/A = not available<br />
a Components may not add to totals due to rounding.<br />
b Seasonally adjusted annual rates.<br />
REPORT TO <strong>CONGRESS</strong> • 2015<br />
119