

CONGRESS
FHFA_2015_Report-to-Congress
FHFA_2015_Report-to-Congress

You also want an ePaper? Increase the reach of your titles
YUMPU automatically turns print PDFs into web optimized ePapers that Google loves.
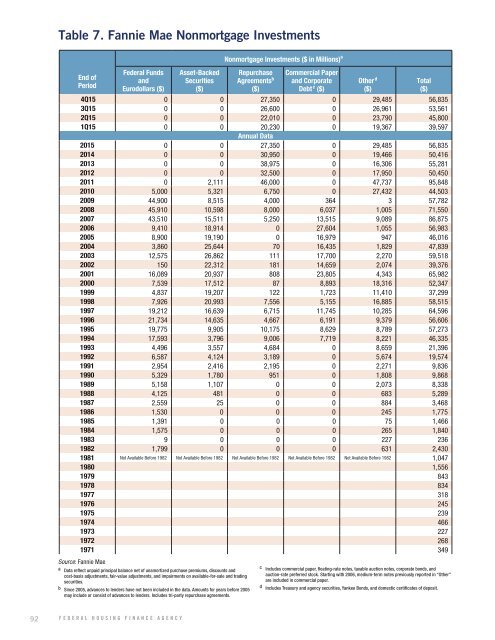
Table 7. Fannie Mae Nonmortgage Investments<br />
End of<br />
Period<br />
Federal Funds<br />
and<br />
Eurodollars ($)<br />
Asset-Backed<br />
Securities<br />
($)<br />
Nonmortgage Investments ($ in Millions) a<br />
Repurchase<br />
Agreements b<br />
($)<br />
Commercial Paper<br />
and Corporate<br />
Debt c ($)<br />
Other d<br />
($)<br />
4Q15 0 0 27,350 0 29,485 56,835<br />
3Q15 0 0 26,600 0 26,961 53,561<br />
2Q15 0 0 22,010 0 23,790 45,800<br />
1Q15 0 0 20,230 0 19,367 39,597<br />
Annual Data<br />
2015 0 0 27,350 0 29,485 56,835<br />
2014 0 0 30,950 0 19,466 50,416<br />
2013 0 0 38,975 0 16,306 55,281<br />
2012 0 0 32,500 0 17,950 50,450<br />
2011 0 2,111 46,000 0 47,737 95,848<br />
2010 5,000 5,321 6,750 0 27,432 44,503<br />
2009 44,900 8,515 4,000 364 3 57,782<br />
2008 45,910 10,598 8,000 6,037 1,005 71,550<br />
2007 43,510 15,511 5,250 13,515 9,089 86,875<br />
2006 9,410 18,914 0 27,604 1,055 56,983<br />
2005 8,900 19,190 0 16,979 947 46,016<br />
2004 3,860 25,644 70 16,435 1,829 47,839<br />
2003 12,575 26,862 111 17,700 2,270 59,518<br />
2002 150 22,312 181 14,659 2,074 39,376<br />
2001 16,089 20,937 808 23,805 4,343 65,982<br />
2000 7,539 17,512 87 8,893 18,316 52,347<br />
1999 4,837 19,207 122 1,723 11,410 37,299<br />
1998 7,926 20,993 7,556 5,155 16,885 58,515<br />
1997 19,212 16,639 6,715 11,745 10,285 64,596<br />
1996 21,734 14,635 4,667 6,191 9,379 56,606<br />
1995 19,775 9,905 10,175 8,629 8,789 57,273<br />
1994 17,593 3,796 9,006 7,719 8,221 46,335<br />
1993 4,496 3,557 4,684 0 8,659 21,396<br />
1992 6,587 4,124 3,189 0 5,674 19,574<br />
1991 2,954 2,416 2,195 0 2,271 9,836<br />
1990 5,329 1,780 951 0 1,808 9,868<br />
1989 5,158 1,107 0 0 2,073 8,338<br />
1988 4,125 481 0 0 683 5,289<br />
1987 2,559 25 0 0 884 3,468<br />
1986 1,530 0 0 0 245 1,775<br />
1985 1,391 0 0 0 75 1,466<br />
1984 1,575 0 0 0 265 1,840<br />
1983 9 0 0 0 227 236<br />
1982 1,799 0 0 0 631 2,430<br />
1981 Not Available Before 1982 Not Available Before 1982 Not Available Before 1982 Not Available Before 1982 Not Available Before 1982 1,047<br />
1980 1,556<br />
1979 843<br />
1978 834<br />
1977 318<br />
1976 245<br />
1975 239<br />
1974 466<br />
1973 227<br />
1972 268<br />
1971 349<br />
Total<br />
($)<br />
Source: Fannie Mae<br />
a Data reflect unpaid principal balance net of unamortized purchase premiums, discounts and<br />
cost-basis adjustments, fair-value adjustments, and impairments on available-for-sale and trading<br />
securities.<br />
b Since 2005, advances to lenders have not been included in the data. Amounts for years before 2005<br />
may include or consist of advances to lenders. Includes tri-party repurchase agreements.<br />
c Includes commercial paper, floating-rate notes, taxable auction notes, corporate bonds, and<br />
auction-rate preferred stock. Starting with 2006, medium-term notes previously reported in “Other”<br />
are included in commercial paper.<br />
d Includes Treasury and agency securities, Yankee Bonds, and domestic certificates of deposit.<br />
92 FEDERAL HOUSING FINANCE AGENCY