

CONGRESS
FHFA_2015_Report-to-Congress
FHFA_2015_Report-to-Congress

Create successful ePaper yourself
Turn your PDF publications into a flip-book with our unique Google optimized e-Paper software.
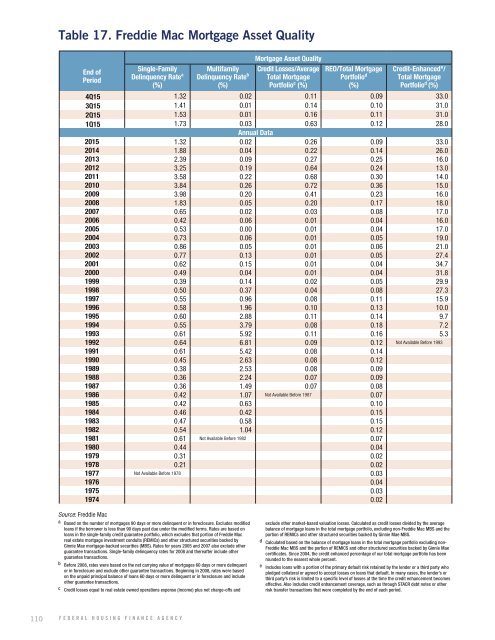
Table 17. Freddie Mac Mortgage Asset Quality<br />
End of<br />
Period<br />
Single-Family<br />
Delinquency Rate a<br />
(%)<br />
Multifamily<br />
Delinquency Rate b<br />
(%)<br />
Mortgage Asset Quality<br />
Credit Losses/Average<br />
Total Mortgage<br />
Portfolio c (%)<br />
REO/Total Mortgage<br />
Portfolio d<br />
(%)<br />
Credit-Enhanced e /<br />
Total Mortgage<br />
Portfolio d (%)<br />
4Q15 1.32 0.02 0.11 0.09 33.0<br />
3Q15 1.41 0.01 0.14 0.10 31.0<br />
2Q15 1.53 0.01 0.16 0.11 31.0<br />
1Q15 1.73 0.03 0.63 0.12 28.0<br />
Annual Data<br />
2015 1.32 0.02 0.26 0.09 33.0<br />
2014 1.88 0.04 0.22 0.14 26.0<br />
2013 2.39 0.09 0.27 0.25 16.0<br />
2012 3.25 0.19 0.64 0.24 13.0<br />
2011 3.58 0.22 0.68 0.30 14.0<br />
2010 3.84 0.26 0.72 0.36 15.0<br />
2009 3.98 0.20 0.41 0.23 16.0<br />
2008 1.83 0.05 0.20 0.17 18.0<br />
2007 0.65 0.02 0.03 0.08 17.0<br />
2006 0.42 0.06 0.01 0.04 16.0<br />
2005 0.53 0.00 0.01 0.04 17.0<br />
2004 0.73 0.06 0.01 0.05 19.0<br />
2003 0.86 0.05 0.01 0.06 21.0<br />
2002 0.77 0.13 0.01 0.05 27.4<br />
2001 0.62 0.15 0.01 0.04 34.7<br />
2000 0.49 0.04 0.01 0.04 31.8<br />
1999 0.39 0.14 0.02 0.05 29.9<br />
1998 0.50 0.37 0.04 0.08 27.3<br />
1997 0.55 0.96 0.08 0.11 15.9<br />
1996 0.58 1.96 0.10 0.13 10.0<br />
1995 0.60 2.88 0.11 0.14 9.7<br />
1994 0.55 3.79 0.08 0.18 7.2<br />
1993 0.61 5.92 0.11 0.16 5.3<br />
1992 0.64 6.81 0.09 0.12 Not Available Before 1993<br />
1991 0.61 5.42 0.08 0.14<br />
1990 0.45 2.63 0.08 0.12<br />
1989 0.38 2.53 0.08 0.09<br />
1988 0.36 2.24 0.07 0.09<br />
1987 0.36 1.49 0.07 0.08<br />
1986 0.42 1.07 Not Available Before 1987 0.07<br />
1985 0.42 0.63 0.10<br />
1984 0.46 0.42 0.15<br />
1983 0.47 0.58 0.15<br />
1982 0.54 1.04 0.12<br />
1981 0.61 Not Available Before 1982 0.07<br />
1980 0.44 0.04<br />
1979 0.31 0.02<br />
1978 0.21 0.02<br />
1977 Not Available Before 1978 0.03<br />
1976 0.04<br />
1975 0.03<br />
1974 0.02<br />
Source: Freddie Mac<br />
a Based on the number of mortgages 90 days or more delinquent or in foreclosure. Excludes modified<br />
loans if the borrower is less than 90 days past due under the modified terms. Rates are based on<br />
loans in the single-family credit guarantee portfolio, which excludes that portion of Freddie Mac<br />
real estate mortgage investment conduits (REMICs) and other structured securities backed by<br />
Ginnie Mae mortgage-backed securities (MBS). Rates for years 2005 and 2007 also exclude other<br />
guarantee transactions. Single-family delinquency rates for 2008 and thereafter include other<br />
guarantee transactions.<br />
b Before 2008, rates were based on the net carrying value of mortgages 60 days or more delinquent<br />
or in foreclosure and exclude other guarantee transactions. Beginning in 2008, rates were based<br />
on the unpaid principal balance of loans 60 days or more delinquent or in foreclosure and include<br />
other guarantee transactions.<br />
c Credit losses equal to real estate owned operations expense (income) plus net charge-offs and<br />
exclude other market-based valuation losses. Calculated as credit losses divided by the average<br />
balance of mortgage loans in the total mortgage portfolio, excluding non-Freddie Mac MBS and the<br />
portion of REMICs and other structured securities backed by Ginnie Mae MBS.<br />
d Calculated based on the balance of mortgage loans in the total mortgage portfolio excluding non-<br />
Freddie Mac MBS and the portion of REMICS and other structured securities backed by Ginnie Mae<br />
certificates. Since 2004, the credit enhanced percentage of our total mortgage portfolio has been<br />
rounded to the nearest whole percent.<br />
e Includes loans with a portion of the primary default risk retained by the lender or a third party who<br />
pledged collateral or agreed to accept losses on loans that default. In many cases, the lender’s or<br />
third party’s risk is limited to a specific level of losses at the time the credit enhancement becomes<br />
effective. Also includes credit enhancement coverage, such as through STACR debt notes or other<br />
risk transfer transactions that were completed by the end of each period.<br />
110 FEDERAL HOUSING FINANCE AGENCY