

CONGRESS
FHFA_2015_Report-to-Congress
FHFA_2015_Report-to-Congress

You also want an ePaper? Increase the reach of your titles
YUMPU automatically turns print PDFs into web optimized ePapers that Google loves.
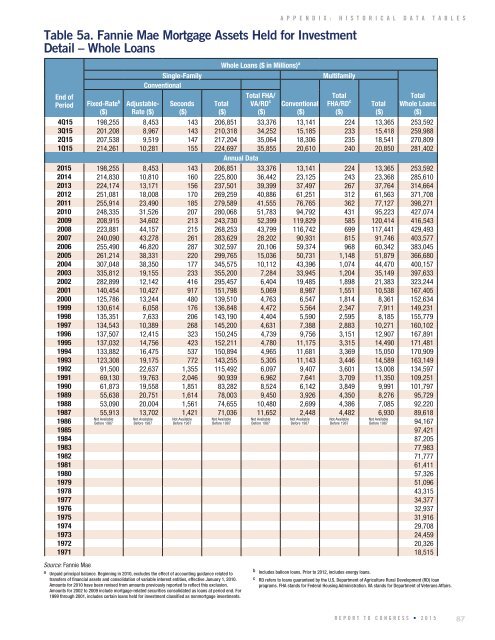
Table 5a. Fannie Mae Mortgage Assets Held for Investment<br />
Detail – Whole Loans<br />
End of<br />
Period<br />
Fixed-Rate b<br />
($)<br />
Single-Family<br />
Conventional<br />
Adjustable-<br />
Rate ($)<br />
Seconds<br />
($)<br />
Whole Loans ($ in Millions) a<br />
Total<br />
($)<br />
Total FHA/<br />
VA/RD c<br />
($)<br />
A P P E N D I X : H I S T O R I C A L D A T A T A B L E S<br />
Conventional<br />
($)<br />
Multifamily<br />
Total<br />
FHA/RD c<br />
($)<br />
Total<br />
($)<br />
Total<br />
Whole Loans<br />
($)<br />
4Q15 198,255 8,453 143 206,851 33,376 13,141 224 13,365 253,592<br />
3Q15 201,208 8,967 143 210,318 34,252 15,185 233 15,418 259,988<br />
2Q15 207,538 9,519 147 217,204 35,064 18,306 235 18,541 270,809<br />
1Q15 214,261 10,281 155 224,697 35,855 20,610 240 20,850 281,402<br />
Annual Data<br />
2015 198,255 8,453 143 206,851 33,376 13,141 224 13,365 253,592<br />
2014 214,830 10,810 160 225,800 36,442 23,125 243 23,368 285,610<br />
2013 224,174 13,171 156 237,501 39,399 37,497 267 37,764 314,664<br />
2012 251,081 18,008 170 269,259 40,886 61,251 312 61,563 371,708<br />
2011 255,914 23,490 185 279,589 41,555 76,765 362 77,127 398,271<br />
2010 248,335 31,526 207 280,068 51,783 94,792 431 95,223 427,074<br />
2009 208,915 34,602 213 243,730 52,399 119,829 585 120,414 416,543<br />
2008 223,881 44,157 215 268,253 43,799 116,742 699 117,441 429,493<br />
2007 240,090 43,278 261 283,629 28,202 90,931 815 91,746 403,577<br />
2006 255,490 46,820 287 302,597 20,106 59,374 968 60,342 383,045<br />
2005 261,214 38,331 220 299,765 15,036 50,731 1,148 51,879 366,680<br />
2004 307,048 38,350 177 345,575 10,112 43,396 1,074 44,470 400,157<br />
2003 335,812 19,155 233 355,200 7,284 33,945 1,204 35,149 397,633<br />
2002 282,899 12,142 416 295,457 6,404 19,485 1,898 21,383 323,244<br />
2001 140,454 10,427 917 151,798 5,069 8,987 1,551 10,538 167,405<br />
2000 125,786 13,244 480 139,510 4,763 6,547 1,814 8,361 152,634<br />
1999 130,614 6,058 176 136,848 4,472 5,564 2,347 7,911 149,231<br />
1998 135,351 7,633 206 143,190 4,404 5,590 2,595 8,185 155,779<br />
1997 134,543 10,389 268 145,200 4,631 7,388 2,883 10,271 160,102<br />
1996 137,507 12,415 323 150,245 4,739 9,756 3,151 12,907 167,891<br />
1995 137,032 14,756 423 152,211 4,780 11,175 3,315 14,490 171,481<br />
1994 133,882 16,475 537 150,894 4,965 11,681 3,369 15,050 170,909<br />
1993 123,308 19,175 772 143,255 5,305 11,143 3,446 14,589 163,149<br />
1992 91,500 22,637 1,355 115,492 6,097 9,407 3,601 13,008 134,597<br />
1991 69,130 19,763 2,046 90,939 6,962 7,641 3,709 11,350 109,251<br />
1990 61,873 19,558 1,851 83,282 8,524 6,142 3,849 9,991 101,797<br />
1989 55,638 20,751 1,614 78,003 9,450 3,926 4,350 8,276 95,729<br />
1988 53,090 20,004 1,561 74,655 10,480 2,699 4,386 7,085 92,220<br />
1987 55,913 13,702 1,421 71,036 11,652 2,448 4,482 6,930 89,618<br />
Not Available<br />
Not Available<br />
Not Available<br />
Not Available<br />
Not Available<br />
Not Available<br />
Not Available<br />
Not Available<br />
1986<br />
Before 1987<br />
Before 1987<br />
Before 1987<br />
Before 1987<br />
Before 1987<br />
Before 1987<br />
Before 1987<br />
Before 1987 94,167<br />
1985 97,421<br />
1984 87,205<br />
1983 77,983<br />
1982 71,777<br />
1981 61,411<br />
1980 57,326<br />
1979 51,096<br />
1978 43,315<br />
1977 34,377<br />
1976 32,937<br />
1975 31,916<br />
1974 29,708<br />
1973 24,459<br />
1972 20,326<br />
1971 18,515<br />
Source: Fannie Mae<br />
a Unpaid principal balance. Beginning in 2010, excludes the effect of accounting guidance related to<br />
transfers of financial assets and consolidation of variable interest entities, effective January 1, 2010.<br />
Amounts for 2010 have been revised from amounts previously reported to reflect this exclusion.<br />
Amounts for 2002 to 2009 include mortgage-related securities consolidated as loans at period end. For<br />
1999 through 2001, includes certain loans held for investment classified as nonmortgage investments.<br />
b Includes balloon loans. Prior to 2012, includes energy loans.<br />
c RD refers to loans guaranteed by the U.S. Department of Agriculture Rural Development (RD) loan<br />
programs. FHA stands for Federal Housing Administration. VA stands for Department of Veterans Affairs.<br />
REPORT TO <strong>CONGRESS</strong> • 2015<br />
87