

CONGRESS
FHFA_2015_Report-to-Congress
FHFA_2015_Report-to-Congress

You also want an ePaper? Increase the reach of your titles
YUMPU automatically turns print PDFs into web optimized ePapers that Google loves.
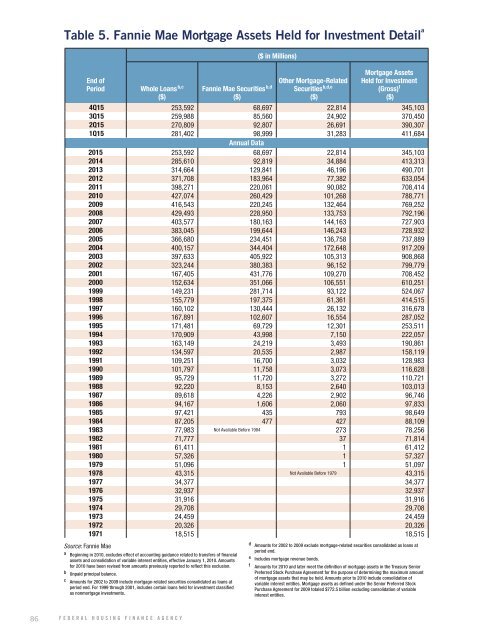
Table 5. Fannie Mae Mortgage Assets Held for Investment Detail a<br />
End of<br />
Period<br />
Whole Loans b,c<br />
($)<br />
Fannie Mae Securities b,d<br />
($)<br />
($ in Millions)<br />
Other Mortgage-Related<br />
Securities b,d,e<br />
($)<br />
Mortgage Assets<br />
Held for Investment<br />
(Gross) f<br />
($)<br />
4Q15 253,592 68,697 22,814 345,103<br />
3Q15 259,988 85,560 24,902 370,450<br />
2Q15 270,809 92,807 26,691 390,307<br />
1Q15 281,402 98,999 31,283 411,684<br />
Annual Data<br />
2015 253,592 68,697 22,814 345,103<br />
2014 285,610 92,819 34,884 413,313<br />
2013 314,664 129,841 46,196 490,701<br />
2012 371,708 183,964 77,382 633,054<br />
2011 398,271 220,061 90,082 708,414<br />
2010 427,074 260,429 101,268 788,771<br />
2009 416,543 220,245 132,464 769,252<br />
2008 429,493 228,950 133,753 792,196<br />
2007 403,577 180,163 144,163 727,903<br />
2006 383,045 199,644 146,243 728,932<br />
2005 366,680 234,451 136,758 737,889<br />
2004 400,157 344,404 172,648 917,209<br />
2003 397,633 405,922 105,313 908,868<br />
2002 323,244 380,383 96,152 799,779<br />
2001 167,405 431,776 109,270 708,452<br />
2000 152,634 351,066 106,551 610,251<br />
1999 149,231 281,714 93,122 524,067<br />
1998 155,779 197,375 61,361 414,515<br />
1997 160,102 130,444 26,132 316,678<br />
1996 167,891 102,607 16,554 287,052<br />
1995 171,481 69,729 12,301 253,511<br />
1994 170,909 43,998 7,150 222,057<br />
1993 163,149 24,219 3,493 190,861<br />
1992 134,597 20,535 2,987 158,119<br />
1991 109,251 16,700 3,032 128,983<br />
1990 101,797 11,758 3,073 116,628<br />
1989 95,729 11,720 3,272 110,721<br />
1988 92,220 8,153 2,640 103,013<br />
1987 89,618 4,226 2,902 96,746<br />
1986 94,167 1,606 2,060 97,833<br />
1985 97,421 435 793 98,649<br />
1984 87,205 477 427 88,109<br />
1983 77,983 Not Available Before 1984 273 78,256<br />
1982 71,777 37 71,814<br />
1981 61,411 1 61,412<br />
1980 57,326 1 57,327<br />
1979 51,096 1 51,097<br />
1978 43,315 Not Available Before 1979 43,315<br />
1977 34,377 34,377<br />
1976 32,937 32,937<br />
1975 31,916 31,916<br />
1974 29,708 29,708<br />
1973 24,459 24,459<br />
1972 20,326 20,326<br />
1971 18,515 18,515<br />
Source: Fannie Mae<br />
a Beginning in 2010, excludes effect of accounting guidance related to transfers of financial<br />
assets and consolidation of variable interest entities, effective January 1, 2010. Amounts<br />
for 2010 have been revised from amounts previously reported to reflect this exclusion.<br />
b Unpaid principal balance.<br />
c Amounts for 2002 to 2009 include mortgage-related securities consolidated as loans at<br />
period end. For 1999 through 2001, includes certain loans held for investment classified<br />
as nonmortgage investments.<br />
d Amounts for 2002 to 2009 exclude mortgage-related securities consolidated as loans at<br />
period end.<br />
e Includes mortgage revenue bonds.<br />
f Amounts for 2010 and later meet the definition of mortgage assets in the Treasury Senior<br />
Preferred Stock Purchase Agreement for the purpose of determining the maximum amount<br />
of mortgage assets that may be held. Amounts prior to 2010 include consolidation of<br />
variable interest entities. Mortgage assets as defined under the Senior Preferred Stock<br />
Purchase Agreement for 2009 totaled $772.5 billion excluding consolidation of variable<br />
interest entities.<br />
86 FEDERAL HOUSING FINANCE AGENCY