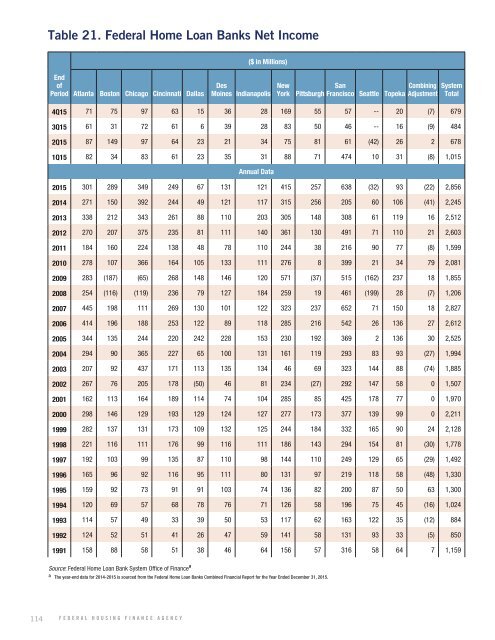
Table 21. Federal Home Loan Banks Net Income ($ in Millions) End of Period Atlanta Boston Chicago Cincinnati Dallas Des Moines Indianapolis New York San Combining Pittsburgh Francisco Seattle Topeka Adjustment System Total 4Q15 71 75 97 63 15 36 28 169 55 57 -- 20 (7) 679 3Q15 61 31 72 61 6 39 28 83 50 46 -- 16 (9) 484 2Q15 87 149 97 64 23 21 34 75 81 61 (42) 26 2 678 1Q15 82 34 83 61 23 35 31 88 71 474 10 31 (8) 1,015 Annual Data 2015 301 289 349 249 67 131 121 415 257 638 (32) 93 (22) 2,856 2014 271 150 392 244 49 121 117 315 256 205 60 106 (41) 2,245 2013 338 212 343 261 88 110 203 305 148 308 61 119 16 2,512 2012 270 207 375 235 81 111 140 361 130 491 71 110 21 2,603 2011 184 160 224 138 48 78 110 244 38 216 90 77 (8) 1,599 2010 278 107 366 164 105 133 111 276 8 399 21 34 79 2,081 2009 283 (187) (65) 268 148 146 120 571 (37) 515 (162) 237 18 1,855 2008 254 (116) (119) 236 79 127 184 259 19 461 (199) 28 (7) 1,206 2007 445 198 111 269 130 101 122 323 237 652 71 150 18 2,827 2006 414 196 188 253 122 89 118 285 216 542 26 136 27 2,612 2005 344 135 244 220 242 228 153 230 192 369 2 136 30 2,525 2004 294 90 365 227 65 100 131 161 119 293 83 93 (27) 1,994 2003 207 92 437 171 113 135 134 46 69 323 144 88 (74) 1,885 2002 267 76 205 178 (50) 46 81 234 (27) 292 147 58 0 1,507 2001 162 113 164 189 114 74 104 285 85 425 178 77 0 1,970 2000 298 146 129 193 129 124 127 277 173 377 139 99 0 2,211 1999 282 137 131 173 109 132 125 244 184 332 165 90 24 2,128 1998 221 116 111 176 99 116 111 186 143 294 154 81 (30) 1,778 1997 192 103 99 135 87 110 98 144 110 249 129 65 (29) 1,492 1996 165 96 92 116 95 111 80 131 97 219 118 58 (48) 1,330 1995 159 92 73 91 91 103 74 136 82 200 87 50 63 1,300 1994 120 69 57 68 78 76 71 126 58 196 75 45 (16) 1,024 1993 114 57 49 33 39 50 53 117 62 163 122 35 (12) 884 1992 124 52 51 41 26 47 59 141 58 131 93 33 (5) 850 1991 158 88 58 51 38 46 64 156 57 316 58 64 7 1,159 Source: Federal Home Loan Bank System Office of Finance a a The year-end data for 2014-2015 is sourced from the Federal Home Loan Banks Combined Financial Report for the Year Ended December 31, 2015. 114 FEDERAL HOUSING FINANCE AGENCY
Table 22. Federal Home Loan Banks Advances Outstanding A P P E N D I X : H I S T O R I C A L D A T A T A B L E S ($ in Millions) End of Period Atlanta Boston Chicago Cincinnati Dallas Des Moines Indianapolis New York Pittsburgh San Francisco Seattle Topeka System Total 4Q15 104,168 36,076 36,778 73,292 24,747 89,173 26,909 93,874 74,505 50,919 -- 23,580 634,022 3Q15 87,762 33,955 35,044 77,320 22,770 74,484 24,297 90,745 68,804 50,793 -- 25,482 591,457 2Q15 102,208 34,106 34,553 71,108 21,648 68,181 24,318 91,296 71,489 50,188 -- 23,288 592,383 1Q15 85,416 31,179 31,941 66,731 17,215 63,562 21,846 88,524 62,346 43,757 8,406 21,265 542,189 Annual Data 2015 104,168 36,076 36,778 73,292 24,747 89,173 26,909 93,874 74,505 50,919 -- 23,580 634,022 2014 99,644 33,482 32,485 70,406 18,942 65,168 20,790 98,797 63,408 38,986 10,314 18,303 570,726 2013 89,588 27,517 23,489 65,270 15,979 45,650 17,337 90,765 50,247 44,395 10,935 17,425 498,599 2012 87,503 20,790 14,530 53,944 18,395 26,614 18,129 75,888 40,498 43,750 9,135 16,573 425,748 2011 86,971 25,195 15,291 28,424 18,798 26,591 18,568 70,864 30,605 68,164 11,292 17,394 418,156 2010 89,258 28,035 18,901 30,181 25,456 29,253 18,275 81,200 29,708 95,599 13,355 19,368 478,589 2009 114,580 37,591 24,148 35,818 47,263 35,720 22,443 94,349 41,177 133,559 22,257 22,254 631,159 2008 165,856 56,926 38,140 53,916 60,920 41,897 31,249 109,153 62,153 235,664 36,944 35,820 928,638 2007 142,867 55,680 30,221 53,310 46,298 40,412 26,770 82,090 68,798 251,034 45,524 32,057 875,061 2006 101,476 37,342 26,179 41,956 41,168 21,855 22,282 59,013 49,335 183,669 27,961 28,445 640,681 2005 101,265 38,068 24,921 40,262 46,457 22,283 25,814 61,902 47,493 162,873 21,435 27,087 619,860 2004 95,867 30,209 24,192 41,301 47,112 27,175 25,231 68,508 38,980 140,254 14,897 27,490 581,216 2003 88,149 26,074 26,443 43,129 40,595 23,272 28,925 63,923 34,662 92,330 19,653 26,882 514,037 2002 82,244 26,931 24,945 40,063 36,869 23,971 28,944 68,926 29,251 81,237 20,036 25,921 489,338 2001 71,818 24,361 21,902 35,223 32,490 20,745 26,399 60,962 29,311 102,255 24,252 22,822 472,540 2000 58,249 21,594 18,462 31,935 30,195 21,158 24,073 52,396 25,946 110,031 26,240 17,582 437,861 1999 45,216 22,488 17,167 28,134 27,034 22,949 19,433 44,409 36,527 90,514 26,284 15,592 395,747 1998 33,561 15,419 14,899 17,873 22,191 18,673 14,388 31,517 26,050 63,990 21,151 8,477 288,189 1997 23,128 12,052 10,369 14,722 13,043 10,559 11,435 19,601 16,979 49,310 15,223 5,844 202,265 1996 16,774 9,655 10,252 10,882 10,085 10,306 9,570 16,486 12,369 39,222 10,850 4,921 161,372 1995 13,920 8,124 8,282 8,287 9,505 11,226 7,926 15,454 9,657 25,664 9,035 5,185 132,264 1994 14,526 8,504 6,675 7,140 8,039 9,819 7,754 14,509 8,475 25,343 8,899 6,212 125,893 1993 11,340 7,208 4,380 4,274 10,470 6,362 6,078 12,162 6,713 23,847 5,889 4,407 103,131 1992 9,301 5,038 2,873 2,415 7,322 3,314 5,657 8,780 3,547 23,110 5,025 3,502 79,884 1991 8,861 5,297 1,773 2,285 4,634 2,380 5,426 11,804 2,770 24,178 5,647 4,011 79,065 Source: Federal Home Loan Bank System Office of Finance a a The year-end data for 2014-2015 is sourced from the Federal Home Loan Banks Combined Financial Report for the Year Ended December 31, 2015. REPORT TO <strong>CONGRESS</strong> • 2015 115