

CONGRESS
FHFA_2015_Report-to-Congress
FHFA_2015_Report-to-Congress

You also want an ePaper? Increase the reach of your titles
YUMPU automatically turns print PDFs into web optimized ePapers that Google loves.
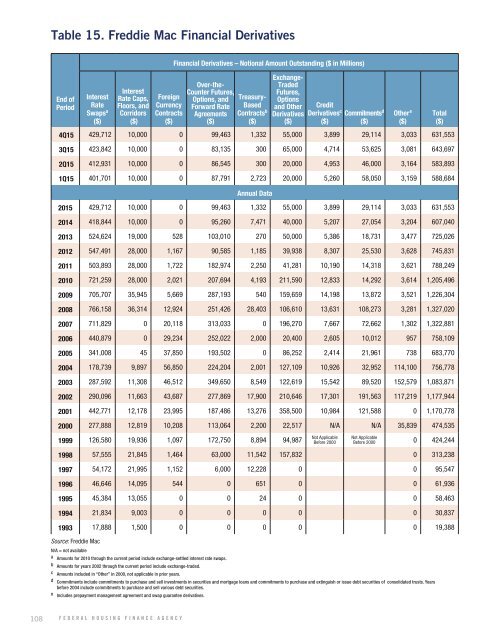
Table 15. Freddie Mac Financial Derivatives<br />
End of<br />
Period<br />
Interest<br />
Rate<br />
Swaps a<br />
($)<br />
Interest<br />
Rate Caps,<br />
Floors, and<br />
Corridors<br />
($)<br />
Foreign<br />
Currency<br />
Contracts<br />
($)<br />
Financial Derivatives – Notional Amount Outstanding ($ in Millions)<br />
Over-the-<br />
Counter Futures,<br />
Options, and<br />
Forward Rate<br />
Agreements<br />
($)<br />
Treasury-<br />
Based<br />
Contracts b<br />
($)<br />
Exchange-<br />
Traded<br />
Futures,<br />
Options<br />
and Other<br />
Derivatives<br />
($)<br />
Credit<br />
Derivatives c Commitments d<br />
($)<br />
($)<br />
4Q15 429,712 10,000 0 99,463 1,332 55,000 3,899 29,114 3,033 631,553<br />
3Q15 423,842 10,000 0 83,135 300 65,000 4,714 53,625 3,081 643,697<br />
2Q15 412,931 10,000 0 86,545 300 20,000 4,953 46,000 3,164 583,893<br />
1Q15 401,701 10,000 0 87,791 2,723 20,000 5,260 58,050 3,159 588,684<br />
Annual Data<br />
2015 429,712 10,000 0 99,463 1,332 55,000 3,899 29,114 3,033 631,553<br />
2014 418,844 10,000 0 95,260 7,471 40,000 5,207 27,054 3,204 607,040<br />
2013 524,624 19,000 528 103,010 270 50,000 5,386 18,731 3,477 725,026<br />
2012 547,491 28,000 1,167 90,585 1,185 39,938 8,307 25,530 3,628 745,831<br />
2011 503,893 28,000 1,722 182,974 2,250 41,281 10,190 14,318 3,621 788,249<br />
2010 721,259 28,000 2,021 207,694 4,193 211,590 12,833 14,292 3,614 1,205,496<br />
2009 705,707 35,945 5,669 287,193 540 159,659 14,198 13,872 3,521 1,226,304<br />
2008 766,158 36,314 12,924 251,426 28,403 106,610 13,631 108,273 3,281 1,327,020<br />
2007 711,829 0 20,118 313,033 0 196,270 7,667 72,662 1,302 1,322,881<br />
2006 440,879 0 29,234 252,022 2,000 20,400 2,605 10,012 957 758,109<br />
2005 341,008 45 37,850 193,502 0 86,252 2,414 21,961 738 683,770<br />
2004 178,739 9,897 56,850 224,204 2,001 127,109 10,926 32,952 114,100 756,778<br />
2003 287,592 11,308 46,512 349,650 8,549 122,619 15,542 89,520 152,579 1,083,871<br />
2002 290,096 11,663 43,687 277,869 17,900 210,646 17,301 191,563 117,219 1,177,944<br />
2001 442,771 12,178 23,995 187,486 13,276 358,500 10,984 121,588 0 1,170,778<br />
2000 277,888 12,819 10,208 113,064 2,200 22,517 N/A N/A 35,839 474,535<br />
1999 126,580 19,936 1,097 172,750 8,894 94,987<br />
Not Applicable<br />
Before 2000<br />
Other e<br />
($)<br />
Total<br />
($)<br />
Not Applicable<br />
Before 2000 0 424,244<br />
1998 57,555 21,845 1,464 63,000 11,542 157,832 0 313,238<br />
1997 54,172 21,995 1,152 6,000 12,228 0 0 95,547<br />
1996 46,646 14,095 544 0 651 0 0 61,936<br />
1995 45,384 13,055 0 0 24 0 0 58,463<br />
1994 21,834 9,003 0 0 0 0 0 30,837<br />
1993 17,888 1,500 0 0 0 0 0 19,388<br />
Source: Freddie Mac<br />
N/A = not available<br />
a Amounts for 2010 through the current period include exchange-settled interest rate swaps.<br />
b Amounts for years 2002 through the current period include exchange-traded.<br />
c Amounts included in “Other” in 2000, not applicable in prior years.<br />
d Commitments include commitments to purchase and sell investments in securities and mortgage loans and commitments to purchase and extinguish or issue debt securities of consolidated trusts. Years<br />
before 2004 include commitments to purchase and sell various debt securities.<br />
e Includes prepayment management agreement and swap guarantee derivatives.<br />
108 FEDERAL HOUSING FINANCE AGENCY