

CONGRESS
FHFA_2015_Report-to-Congress
FHFA_2015_Report-to-Congress

You also want an ePaper? Increase the reach of your titles
YUMPU automatically turns print PDFs into web optimized ePapers that Google loves.
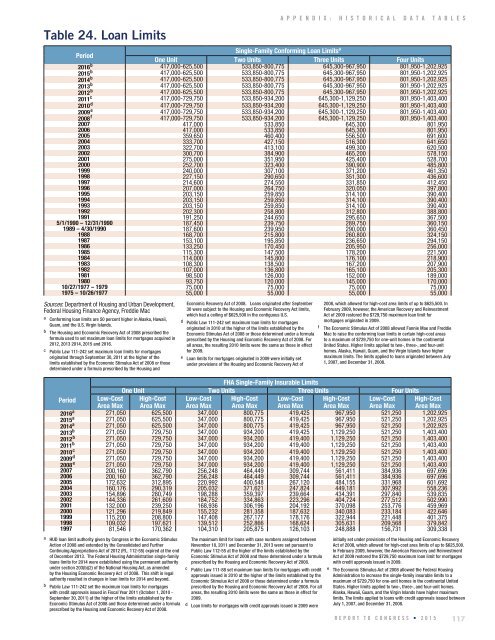
Table 24. Loan Limits<br />
A P P E N D I X : H I S T O R I C A L D A T A T A B L E S<br />
Period<br />
Single-Family Conforming Loan Limits a<br />
One Unit Two Units Three Units Four Units<br />
2016 b 417,000-625,500 533,850-800,775 645,300-967,950 801,950-1,202,925<br />
2015 b 417,000-625,500 533,850-800,775 645,300-967,950 801,950-1,202,925<br />
2014 b 417,000-625,500 533,850-800,775 645,300-967,950 801,950-1,202,925<br />
2013 b 417,000-625,500 533,850-800,775 645,300-967,950 801,950-1,202,925<br />
2012 b 417,000-625,500 533,850-800,775 645,300-967,950 801,950-1,202,925<br />
2011 c 417,000-729,750 533,850-934,200 645,300-1,129,250 801,950-1,403,400<br />
2010 d 417,000-729,750 533,850-934,200 645,300-1,129,250 801,950-1,403,400<br />
2009 e 417,000-729,750 533,850-934,200 645,300-1,129,250 801,950-1,403,400<br />
2008 f 417,000-729,750 533,850-934,200 645,300-1,129,250 801,950-1,403,400<br />
2007 417,000 533,850 645,300 801,950<br />
2006 417,000 533,850 645,300 801,950<br />
2005 359,650 460,400 556,500 691,600<br />
2004 333,700 427,150 516,300 641,650<br />
2003 322,700 413,100 499,300 620,500<br />
2002 300,700 384,900 465,200 578,150<br />
2001 275,000 351,950 425,400 528,700<br />
2000 252,700 323,400 390,900 485,800<br />
1999 240,000 307,100 371,200 461,350<br />
1998 227,150 290,650 351,300 436,600<br />
1997 214,600 274,550 331,850 412,450<br />
1996 207,000 264,750 320,050 397,800<br />
1995 203,150 259,850 314,100 390,400<br />
1994 203,150 259,850 314,100 390,400<br />
1993 203,150 259,850 314,100 390,400<br />
1992 202,300 258,800 312,800 388,800<br />
1991 191,250 244,650 295,650 367,500<br />
5/1/1990 – 12/31/1990 187,450 239,750 289,750 360,150<br />
1989 – 4/30/1990 187,600 239,950 290,000 360,450<br />
1988 168,700 215,800 260,800 324,150<br />
1987 153,100 195,850 236,650 294,150<br />
1986 133,250 170,450 205,950 256,000<br />
1985 115,300 147,500 178,200 221,500<br />
1984 114,000 145,800 176,100 218,900<br />
1983 108,300 138,500 167,200 207,900<br />
1982 107,000 136,800 165,100 205,300<br />
1981 98,500 126,000 152,000 189,000<br />
1980 93,750 120,000 145,000 170,000<br />
10/27/1977 – 1979 75,000 75,000 75,000 75,000<br />
1975 – 10/26/1977 55,000 55,000 55,000 55,000<br />
Sources: Department of Housing and Urban Development,<br />
Federal Housing Finance Agency, Freddie Mac<br />
a Conforming loan limits are 50 percent higher in Alaska, Hawaii,<br />
Guam, and the U.S. Virgin Islands.<br />
b The Housing and Economic Recovery Act of 2008 prescribed the<br />
formula used to set maximum loan limits for mortgages acquired in<br />
2012, 2013 2014, 2015 and 2016.<br />
c Public Law 111-242 set maximum loan limits for mortgages<br />
originated through September 30, 2011 at the higher of the<br />
limits established by the Economic Stimulus Act of 2008 or those<br />
determined under a formula prescribed by the Housing and<br />
FHA Single-Family Insurable Limits<br />
One Unit Two Units Three Units Four Units<br />
Period Low-Cost High-Cost Low-Cost High-Cost Low-Cost High-Cost Low-Cost High-Cost<br />
Area Max Area Max Area Max Area Max Area Max Area Max Area Max Area Max<br />
2016 a 271,050 625,500 347,000 800,775 419,425 967,950 521,250 1,202,925<br />
2015 a 271,050 625,500 347,000 800,775 419,425 967,950 521,250 1,202,925<br />
2014 a 271,050 625,500 347,000 800,775 419,425 967,950 521,250 1,202,925<br />
2013 b 271,050 729,750 347,000 934,200 419,425 1,129,250 521,250 1,403,400<br />
2012 b 271,050 729,750 347,000 934,200 419,400 1,129,250 521,250 1,403,400<br />
2011 b 271,050 729,750 347,000 934,200 419,400 1,129,250 521,250 1,403,400<br />
2010 c 271,050 729,750 347,000 934,200 419,400 1,129,250 521,250 1,403,400<br />
2009 d 271,050 729,750 347,000 934,200 419,400 1,129,250 521,250 1,403,400<br />
2008 e 271,050 729,750 347,000 934,200 419,400 1,129,250 521,250 1,403,400<br />
2007 200,160 362,790 256,248 464,449 309,744 561,411 384,936 697,696<br />
2006 200,160 362,790 256,248 464,449 309,744 561,411 384,936 697,696<br />
2005 172,632 312,895 220,992 400,548 267,120 484,155 331,968 601,692<br />
2004 160,176 290,319 205,032 371,621 247,824 449,181 307,992 558,236<br />
2003 154,896 280,749 198,288 359,397 239,664 434,391 297,840 539,835<br />
2002 144,336 261,609 184,752 334,863 223,296 404,724 277,512 502,990<br />
2001 132,000 239,250 168,936 306,196 204,192 370,098 253,776 459,969<br />
2000 121,296 219,849 155,232 281,358 187,632 340,083 233,184 422,646<br />
1999 115,200 208,800 147,408 267,177 178,176 322,944 221,448 401,375<br />
1998 109,032 197,621 139,512 252,866 168,624 305,631 209,568 379,842<br />
1997 81,546 170,362 104,310 205,875 126,103 248,888 156,731 309,338<br />
a HUD loan limit authority given by Congress in the Economic Stimulus<br />
Action of 2008 and extended by the Consolidated and Further<br />
Continuing Appropriations Act of 2012 (P.L. 112-55) expired at the end<br />
of December 2013. The Federal Housing Administration single-family<br />
loans limits for 2014 were established using the permanent authority<br />
under section 203(b)(2) of the National Housing Act, as amended<br />
by the Housing Economic Recovery Act of 2008. This shift in legal<br />
authority resulted in changes in loan limits for 2014 and beyond.<br />
b Public Law 111-242 set the maximum loan limits for mortgages<br />
with credit approvals issued in Fiscal Year 2011 (October 1, 2010 -<br />
September 30, 2011) at the higher of the limits established by the<br />
Economic Stimulus Act of 2008 and those determined under a formula<br />
prescribed by the Housing and Economic Recovery Act of 2008.<br />
Economic Recovery Act of 2008. Loans originated after September<br />
30 were subject to the Housing and Economic Recovery Act limits,<br />
which had a ceiling of $625,500 in the contiguous U.S.<br />
d Public Law 111-242 set maximum loan limits for mortgages<br />
originated in 2010 at the higher of the limits established by the<br />
Economic Stimulus Act of 2008 or those determined under a formula<br />
prescribed by the Housing and Economic Recovery Act of 2008. For<br />
all areas, the resulting 2010 limits were the same as those in effect<br />
for 2009.<br />
e Loan limits for mortgages originated in 2009 were initially set<br />
under provisions of the Housing and Economic Recovery Act of<br />
The maximum limit for loans with case numbers assigned between<br />
November 18, 2011 and December 31, 2013 were set pursuant to<br />
Public Law 112-55 at the higher of the limits established by the<br />
Economic Stimulus Act of 2008 and those determined under a formula<br />
prescribed by the Housing and Economic Recovery Act of 2008.<br />
c Public Law 111-88 set maximum loan limits for mortgages with credit<br />
approvals issued in 2010 at the higher of the limits established by the<br />
Economic Stimulus Act of 2008 or those determined under a formula<br />
prescribed by the Housing and Economic Recovery Act of 2008. For all<br />
areas, the resulting 2010 limits were the same as those in effect for<br />
2009.<br />
d Loan limits for mortgages with credit approvals issued in 2009 were<br />
f<br />
2008, which allowed for high-cost area limits of up to $625,500. In<br />
February 2009, however, the American Recovery and Reinvestment<br />
Act of 2009 restored the $729,750 maximum loan limit for<br />
mortgages originated in 2009.<br />
The Economic Stimulus Act of 2008 allowed Fannie Mae and Freddie<br />
Mac to raise the conforming loan limits in certain high-cost areas<br />
to a maximum of $729,750 for one-unit homes in the continental<br />
United States. Higher limits applied to two-, three-, and four-unit<br />
homes. Alaska, Hawaii, Guam, and the Virgin Islands have higher<br />
maximum limits. The limits applied to loans originated between July<br />
1, 2007, and December 31, 2008.<br />
initially set under provisions of the Housing and Economic Recovery<br />
Act of 2008, which allowed for high-cost area limits of up to $625,500.<br />
In February 2009, however, the American Recovery and Reinvestment<br />
Act of 2009 restored the $729,750 maximum loan limit for mortgages<br />
with credit approvals issued in 2009.<br />
e The Economic Stimulus Act of 2008 allowed the Federal Housing<br />
Administration to increase the single-family insurable limits to a<br />
maximum of $729,750 for one-unit homes in the continental United<br />
States. Higher limits applied to two-, three-, and four-unit homes.<br />
Alaska, Hawaii, Guam, and the Virgin Islands have higher maximum<br />
limits. The limits applied to loans with credit approvals issued between<br />
July 1, 2007, and December 31, 2008.<br />
REPORT TO <strong>CONGRESS</strong> • 2015<br />
117