

CONGRESS
FHFA_2015_Report-to-Congress
FHFA_2015_Report-to-Congress

You also want an ePaper? Increase the reach of your titles
YUMPU automatically turns print PDFs into web optimized ePapers that Google loves.
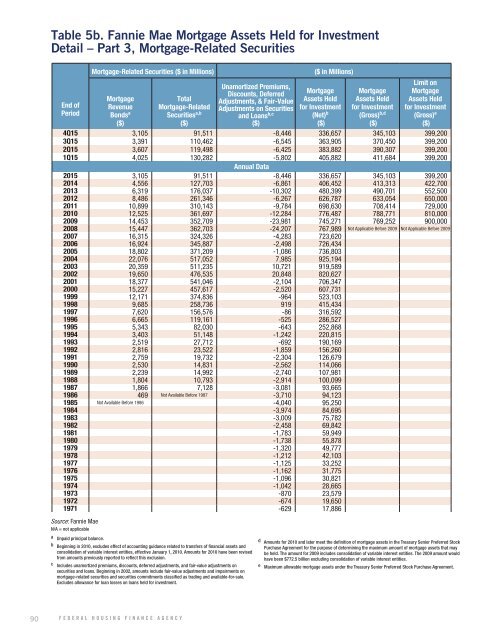
Table 5b. Fannie Mae Mortgage Assets Held for Investment<br />
Detail – Part 3, Mortgage-Related Securities<br />
End of<br />
Period<br />
Mortgage-Related Securities ($ in Millions)<br />
Mortgage<br />
Revenue<br />
Bonds a<br />
($)<br />
Total<br />
Mortgage-Related<br />
Securities a,b<br />
($)<br />
Unamortized Premiums,<br />
Discounts, Deferred<br />
Adjustments, & Fair-Value<br />
Adjustments on Securities<br />
and Loans b,c<br />
($)<br />
($ in Millions)<br />
Mortgage<br />
Assets Held<br />
for Investment<br />
(Net) b<br />
($)<br />
Mortgage<br />
Assets Held<br />
for Investment<br />
(Gross) b,d<br />
($)<br />
Limit on<br />
Mortgage<br />
Assets Held<br />
for Investment<br />
(Gross) e<br />
($)<br />
4Q15 3,105 91,511 -8,446 336,657 345,103 399,200<br />
3Q15 3,391 110,462 -6,545 363,905 370,450 399,200<br />
2Q15 3,607 119,498 -6,425 383,882 390,307 399,200<br />
1Q15 4,025 130,282 -5,802 405,882 411,684 399,200<br />
Annual Data<br />
2015 3,105 91,511 -8,446 336,657 345,103 399,200<br />
2014 4,556 127,703 -6,861 406,452 413,313 422,700<br />
2013 6,319 176,037 -10,302 480,399 490,701 552,500<br />
2012 8,486 261,346 -6,267 626,787 633,054 650,000<br />
2011 10,899 310,143 -9,784 698,630 708,414 729,000<br />
2010 12,525 361,697 -12,284 776,487 788,771 810,000<br />
2009 14,453 352,709 -23,981 745,271 769,252 900,000<br />
2008 15,447 362,703 -24,207 767,989 Not Applicable Before 2009 Not Applicable Before 2009<br />
2007 16,315 324,326 -4,283 723,620<br />
2006 16,924 345,887 -2,498 726,434<br />
2005 18,802 371,209 -1,086 736,803<br />
2004 22,076 517,052 7,985 925,194<br />
2003 20,359 511,235 10,721 919,589<br />
2002 19,650 476,535 20,848 820,627<br />
2001 18,377 541,046 -2,104 706,347<br />
2000 15,227 457,617 -2,520 607,731<br />
1999 12,171 374,836 -964 523,103<br />
1998 9,685 258,736 919 415,434<br />
1997 7,620 156,576 -86 316,592<br />
1996 6,665 119,161 -525 286,527<br />
1995 5,343 82,030 -643 252,868<br />
1994 3,403 51,148 -1,242 220,815<br />
1993 2,519 27,712 -692 190,169<br />
1992 2,816 23,522 -1,859 156,260<br />
1991 2,759 19,732 -2,304 126,679<br />
1990 2,530 14,831 -2,562 114,066<br />
1989 2,239 14,992 -2,740 107,981<br />
1988 1,804 10,793 -2,914 100,099<br />
1987 1,866 7,128 -3,081 93,665<br />
1986 469 Not Available Before 1987 -3,710 94,123<br />
1985 Not Available Before 1986 -4,040 95,250<br />
1984 -3,974 84,695<br />
1983 -3,009 75,782<br />
1982 -2,458 69,842<br />
1981 -1,783 59,949<br />
1980 -1,738 55,878<br />
1979 -1,320 49,777<br />
1978 -1,212 42,103<br />
1977 -1,125 33,252<br />
1976 -1,162 31,775<br />
1975 -1,096 30,821<br />
1974 -1,042 28,665<br />
1973 -870 23,579<br />
1972 -674 19,650<br />
1971 -629 17,886<br />
Source: Fannie Mae<br />
N/A = not applicable<br />
a Unpaid principal balance.<br />
b Beginning in 2010, excludes effect of accounting guidance related to transfers of financial assets and<br />
consolidation of variable interest entities, effective January 1, 2010. Amounts for 2010 have been revised<br />
from amounts previously reported to reflect this exclusion.<br />
c Includes unamortized premiums, discounts, deferred adjustments, and fair-value adjustments on<br />
securities and loans. Beginning in 2002, amounts include fair-value adjustments and impairments on<br />
mortgage-related securities and securities commitments classified as trading and available-for-sale.<br />
Excludes allowance for loan losses on loans held for investment.<br />
d Amounts for 2010 and later meet the definition of mortgage assets in the Treasury Senior Preferred Stock<br />
Purchase Agreement for the purpose of determining the maximum amount of mortgage assets that may<br />
be held. The amount for 2009 includes consolidation of variable interest entities. The 2009 amount would<br />
have been $772.5 billion excluding consolidation of variable interest entities.<br />
e Maximum allowable mortgage assets under the Treasury Senior Preferred Stock Purchase Agreement.<br />
90 FEDERAL HOUSING FINANCE AGENCY