

CONGRESS
FHFA_2015_Report-to-Congress
FHFA_2015_Report-to-Congress

You also want an ePaper? Increase the reach of your titles
YUMPU automatically turns print PDFs into web optimized ePapers that Google loves.
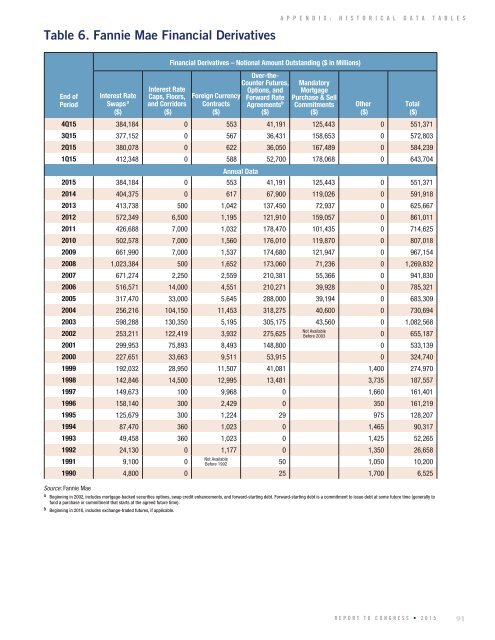
Table 6. Fannie Mae Financial Derivatives<br />
A P P E N D I X : H I S T O R I C A L D A T A T A B L E S<br />
End of<br />
Period<br />
Interest Rate<br />
Swaps a<br />
($)<br />
Interest Rate<br />
Caps, Floors,<br />
and Corridors<br />
($)<br />
Financial Derivatives – Notional Amount Outstanding ($ in Millions)<br />
Foreign Currency<br />
Contracts<br />
($)<br />
Over-the-<br />
Counter Futures,<br />
Options, and<br />
Forward Rate<br />
Agreements b<br />
($)<br />
Mandatory<br />
Mortgage<br />
Purchase & Sell<br />
Commitments<br />
($)<br />
4Q15 384,184 0 553 41,191 125,443 0 551,371<br />
3Q15 377,152 0 567 36,431 158,653 0 572,803<br />
2Q15 380,078 0 622 36,050 167,489 0 584,239<br />
1Q15 412,348 0 588 52,700 178,068 0 643,704<br />
Annual Data<br />
2015 384,184 0 553 41,191 125,443 0 551,371<br />
2014 404,375 0 617 67,900 119,026 0 591,918<br />
2013 413,738 500 1,042 137,450 72,937 0 625,667<br />
2012 572,349 6,500 1,195 121,910 159,057 0 861,011<br />
2011 426,688 7,000 1,032 178,470 101,435 0 714,625<br />
2010 502,578 7,000 1,560 176,010 119,870 0 807,018<br />
2009 661,990 7,000 1,537 174,680 121,947 0 967,154<br />
2008 1,023,384 500 1,652 173,060 71,236 0 1,269,832<br />
2007 671,274 2,250 2,559 210,381 55,366 0 941,830<br />
2006 516,571 14,000 4,551 210,271 39,928 0 785,321<br />
2005 317,470 33,000 5,645 288,000 39,194 0 683,309<br />
2004 256,216 104,150 11,453 318,275 40,600 0 730,694<br />
2003 598,288 130,350 5,195 305,175 43,560 0 1,082,568<br />
2002 253,211 122,419 3,932 275,625<br />
Other<br />
($)<br />
Total<br />
($)<br />
Not Available<br />
Before 2003 0 655,187<br />
2001 299,953 75,893 8,493 148,800 0 533,139<br />
2000 227,651 33,663 9,511 53,915 0 324,740<br />
1999 192,032 28,950 11,507 41,081 1,400 274,970<br />
1998 142,846 14,500 12,995 13,481 3,735 187,557<br />
1997 149,673 100 9,968 0 1,660 161,401<br />
1996 158,140 300 2,429 0 350 161,219<br />
1995 125,679 300 1,224 29 975 128,207<br />
1994 87,470 360 1,023 0 1,465 90,317<br />
1993 49,458 360 1,023 0 1,425 52,265<br />
1992 24,130 0 1,177 0 1,350 26,658<br />
1991 9,100 0<br />
Not Available<br />
Before 1992 50 1,050 10,200<br />
1990 4,800 0 25 1,700 6,525<br />
Source: Fannie Mae<br />
a Beginning in 2002, includes mortgage-backed securities options, swap credit enhancements, and forward-starting debt. Forward-starting debt is a commitment to issue debt at some future time (generally to<br />
fund a purchase or commitment that starts at the agreed future time).<br />
b Beginning in 2010, includes exchange-traded futures, if applicable.<br />
REPORT TO <strong>CONGRESS</strong> • 2015<br />
91