

CONGRESS
FHFA_2015_Report-to-Congress
FHFA_2015_Report-to-Congress

You also want an ePaper? Increase the reach of your titles
YUMPU automatically turns print PDFs into web optimized ePapers that Google loves.
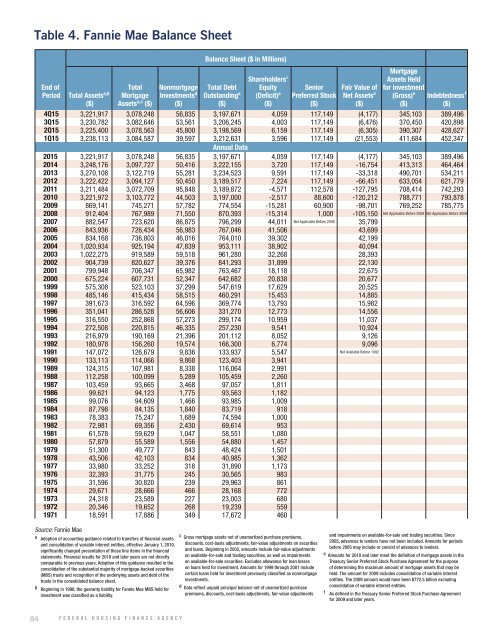
Table 4. Fannie Mae Balance Sheet<br />
End of<br />
Period<br />
Total Assets a,b<br />
($)<br />
Total<br />
Mortgage<br />
Assets a,c ($)<br />
Nonmortgage<br />
Investments d<br />
($)<br />
Balance Sheet ($ in Millions)<br />
Total Debt<br />
Outstanding a<br />
($)<br />
Shareholders’<br />
Equity<br />
(Deficit) a<br />
($)<br />
Senior<br />
Preferred Stock<br />
($)<br />
Fair Value of<br />
Net Assets a<br />
($)<br />
Mortgage<br />
Assets Held<br />
for Investment<br />
(Gross) e Indebtedness f<br />
($)<br />
($)<br />
4Q15 3,221,917 3,078,248 56,835 3,197,671 4,059 117,149 (4,177) 345,103 389,496<br />
3Q15 3,230,782 3,082,646 53,561 3,206,245 4,003 117,149 (6,476) 370,450 420,898<br />
2Q15 3,225,400 3,078,563 45,800 3,198,569 6,159 117,149 (6,305) 390,307 428,627<br />
1Q15 3,238,113 3,084,587 39,597 3,212,631 3,596 117,149 (21,553) 411,684 452,347<br />
Annual Data<br />
2015 3,221,917 3,078,248 56,835 3,197,671 4,059 117,149 (4,177) 345,103 389,496<br />
2014 3,248,176 3,097,727 50,416 3,222,155 3,720 117,149 -16,754 413,313 464,464<br />
2013 3,270,108 3,122,719 55,281 3,234,523 9,591 117,149 -33,318 490,701 534,211<br />
2012 3,222,422 3,094,127 50,450 3,189,517 7,224 117,149 -66,451 633,054 621,779<br />
2011 3,211,484 3,072,709 95,848 3,189,872 -4,571 112,578 -127,795 708,414 742,293<br />
2010 3,221,972 3,103,772 44,503 3,197,000 -2,517 88,600 -120,212 788,771 793,878<br />
2009 869,141 745,271 57,782 774,554 -15,281 60,900 -98,701 769,252 785,775<br />
2008 912,404 767,989 71,550 870,393 -15,314 1,000 -105,150<br />
2007 882,547 723,620 86,875 796,299 44,011 Not Applicable Before 2008 35,799<br />
2006 843,936 726,434 56,983 767,046 41,506 43,699<br />
2005 834,168 736,803 46,016 764,010 39,302 42,199<br />
2004 1,020,934 925,194 47,839 953,111 38,902 40,094<br />
2003 1,022,275 919,589 59,518 961,280 32,268 28,393<br />
2002 904,739 820,627 39,376 841,293 31,899 22,130<br />
2001 799,948 706,347 65,982 763,467 18,118 22,675<br />
2000 675,224 607,731 52,347 642,682 20,838 20,677<br />
1999 575,308 523,103 37,299 547,619 17,629 20,525<br />
1998 485,146 415,434 58,515 460,291 15,453 14,885<br />
1997 391,673 316,592 64,596 369,774 13,793 15,982<br />
1996 351,041 286,528 56,606 331,270 12,773 14,556<br />
1995 316,550 252,868 57,273 299,174 10,959 11,037<br />
1994 272,508 220,815 46,335 257,230 9,541 10,924<br />
1993 216,979 190,169 21,396 201,112 8,052 9,126<br />
1992 180,978 156,260 19,574 166,300 6,774 9,096<br />
1991 147,072 126,679 9,836 133,937 5,547 Not Available Before 1992<br />
1990 133,113 114,066 9,868 123,403 3,941<br />
1989 124,315 107,981 8,338 116,064 2,991<br />
1988 112,258 100,099 5,289 105,459 2,260<br />
1987 103,459 93,665 3,468 97,057 1,811<br />
1986 99,621 94,123 1,775 93,563 1,182<br />
1985 99,076 94,609 1,466 93,985 1,009<br />
1984 87,798 84,135 1,840 83,719 918<br />
1983 78,383 75,247 1,689 74,594 1,000<br />
1982 72,981 69,356 2,430 69,614 953<br />
1981 61,578 59,629 1,047 58,551 1,080<br />
1980 57,879 55,589 1,556 54,880 1,457<br />
1979 51,300 49,777 843 48,424 1,501<br />
1978 43,506 42,103 834 40,985 1,362<br />
1977 33,980 33,252 318 31,890 1,173<br />
1976 32,393 31,775 245 30,565 983<br />
1975 31,596 30,820 239 29,963 861<br />
1974 29,671 28,666 466 28,168 772<br />
1973 24,318 23,589 227 23,003 680<br />
1972 20,346 19,652 268 19,239 559<br />
1971 18,591 17,886 349 17,672 460<br />
Source: Fannie Mae<br />
a Adoption of accounting guidance related to transfers of financial assets<br />
and consolidation of variable interest entities, effective January 1, 2010,<br />
significantly changed presentation of these line items in the financial<br />
statements. Financial results for 2010 and later years are not directly<br />
comparable to previous years. Adoption of this guidance resulted in the<br />
consolidation of the substantial majority of mortgage-backed securities<br />
(MBS) trusts and recognition of the underlying assets and debt of the<br />
trusts in the consolidated balance sheet.<br />
b Beginning in 1998, the guaranty liability for Fannie Mae MBS held for<br />
investment was classified as a liability.<br />
c Gross mortgage assets net of unamortized purchase premiums,<br />
discounts, cost-basis adjustments, fair-value adjustments on securities<br />
and loans. Beginning in 2002, amounts include fair-value adjustments<br />
on available-for-sale and trading securities, as well as impairments<br />
on available-for-sale securities. Excludes allowance for loan losses<br />
on loans held for investment. Amounts for 1999 through 2001 include<br />
certain loans held for investment previously classified as nonmortgage<br />
investments.<br />
d Data reflect unpaid principal balance net of unamortized purchase<br />
premiums, discounts, cost-basis adjustments, fair-value adjustments<br />
Not Applicable Before 2009 Not Applicable Before 2009<br />
and impairments on available-for-sale and trading securities. Since<br />
2005, advances to lenders have not been included. Amounts for periods<br />
before 2005 may include or consist of advances to lenders.<br />
e Amounts for 2010 and later meet the definition of mortgage assets in the<br />
Treasury Senior Preferred Stock Purchase Agreement for the purpose<br />
of determining the maximum amount of mortgage assets that may be<br />
held. The amount for 2009 includes consolidation of variable interest<br />
entities. The 2009 amount would have been $772.5 billion excluding<br />
consolidation of variable interest entities.<br />
f As defined in the Treasury Senior Preferred Stock Purchase Agreement<br />
for 2009 and later years.<br />
84 FEDERAL HOUSING FINANCE AGENCY