

CONGRESS
FHFA_2015_Report-to-Congress
FHFA_2015_Report-to-Congress

You also want an ePaper? Increase the reach of your titles
YUMPU automatically turns print PDFs into web optimized ePapers that Google loves.
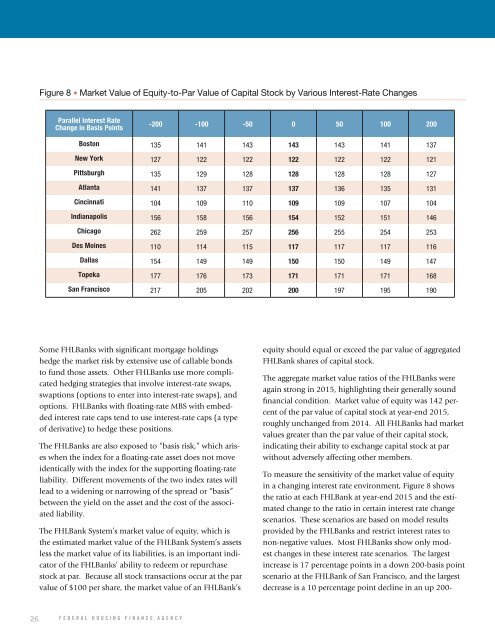
Figure 8 • Market Value of Equity-to-Par Value of Capital Stock by Various Interest-Rate Changes<br />
Parallel Interest Rate<br />
Change in Basis Points<br />
-200 -100 -50 0 50 100 200<br />
Boston 135 141 143 143 143 141 137<br />
New York 127 122 122 122 122 122 121<br />
Pittsburgh 135 129 128 128 128 128 127<br />
Atlanta 141 137 137 137 136 135 131<br />
Cincinnati 104 109 110 109 109 107 104<br />
Indianapolis 156 158 156 154 152 151 146<br />
Chicago 262 259 257 256 255 254 253<br />
Des Moines 110 114 115 117 117 117 116<br />
Dallas 154 149 149 150 150 149 147<br />
Topeka 177 176 173 171 171 171 168<br />
San Francisco 217 205 202 200 197 195 190<br />
Some FHLBanks with significant mortgage holdings<br />
hedge the market risk by extensive use of callable bonds<br />
to fund those assets. Other FHLBanks use more complicated<br />
hedging strategies that involve interest-rate swaps,<br />
swaptions (options to enter into interest-rate swaps), and<br />
options. FHLBanks with floating-rate MBS with embedded<br />
interest rate caps tend to use interest-rate caps (a type<br />
of derivative) to hedge these positions.<br />
The FHLBanks are also exposed to “basis risk,” which arises<br />
when the index for a floating-rate asset does not move<br />
identically with the index for the supporting floating-rate<br />
liability. Different movements of the two index rates will<br />
lead to a widening or narrowing of the spread or “basis”<br />
between the yield on the asset and the cost of the associated<br />
liability.<br />
The FHLBank System’s market value of equity, which is<br />
the estimated market value of the FHLBank System’s assets<br />
less the market value of its liabilities, is an important indicator<br />
of the FHLBanks’ ability to redeem or repurchase<br />
stock at par. Because all stock transactions occur at the par<br />
value of $100 per share, the market value of an FHLBank’s<br />
equity should equal or exceed the par value of aggregated<br />
FHLBank shares of capital stock.<br />
The aggregate market value ratios of the FHLBanks were<br />
again strong in 2015, highlighting their generally sound<br />
financial condition. Market value of equity was 142 percent<br />
of the par value of capital stock at year-end 2015,<br />
roughly unchanged from 2014. All FHLBanks had market<br />
values greater than the par value of their capital stock,<br />
indicating their ability to exchange capital stock at par<br />
without adversely affecting other members.<br />
To measure the sensitivity of the market value of equity<br />
in a changing interest rate environment, Figure 8 shows<br />
the ratio at each FHLBank at year-end 2015 and the estimated<br />
change to the ratio in certain interest rate change<br />
scenarios. These scenarios are based on model results<br />
provided by the FHLBanks and restrict interest rates to<br />
non-negative values. Most FHLBanks show only modest<br />
changes in these interest rate scenarios. The largest<br />
increase is 17 percentage points in a down 200-basis point<br />
scenario at the FHLBank of San Francisco, and the largest<br />
decrease is a 10 percentage point decline in an up 200-<br />
26 FEDERAL HOUSING FINANCE AGENCY