Ten-Year Impacts of Burkina Faso’s BRIGHT Program
n?u=RePEc:mpr:mprres:2ecdd42bb503422b802ce20da2bf64b7&r=edu
n?u=RePEc:mpr:mprres:2ecdd42bb503422b802ce20da2bf64b7&r=edu

You also want an ePaper? Increase the reach of your titles
YUMPU automatically turns print PDFs into web optimized ePapers that Google loves.
I: INTRODUCTION MATHEMATICA POLICY RESEARCH<br />
evaluation design is the same design previously used to assess the 3-year and 7-year impacts <strong>of</strong><br />
<strong>BRIGHT</strong>.<br />
b. Overview <strong>of</strong> the 7-year impact findings<br />
Using survey data collected in 2012, we conducted a 7-year impact evaluation <strong>of</strong> the<br />
<strong>BRIGHT</strong> program examining impacts for children between ages 6 and 17. The evaluation sought<br />
to measure the impacts <strong>of</strong> <strong>BRIGHT</strong> on school enrollment, test scores, health, and child labor. We<br />
summarize the findings below.<br />
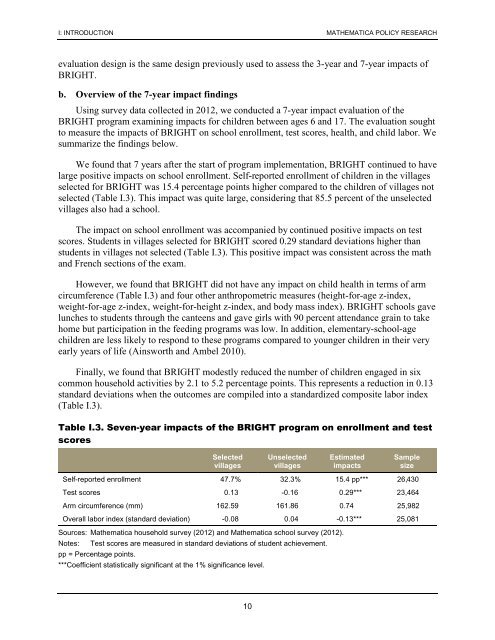
We found that 7 years after the start <strong>of</strong> program implementation, <strong>BRIGHT</strong> continued to have<br />
large positive impacts on school enrollment. Self-reported enrollment <strong>of</strong> children in the villages<br />
selected for <strong>BRIGHT</strong> was 15.4 percentage points higher compared to the children <strong>of</strong> villages not<br />
selected (Table I.3). This impact was quite large, considering that 85.5 percent <strong>of</strong> the unselected<br />
villages also had a school.<br />
The impact on school enrollment was accompanied by continued positive impacts on test<br />
scores. Students in villages selected for <strong>BRIGHT</strong> scored 0.29 standard deviations higher than<br />
students in villages not selected (Table I.3). This positive impact was consistent across the math<br />
and French sections <strong>of</strong> the exam.<br />
However, we found that <strong>BRIGHT</strong> did not have any impact on child health in terms <strong>of</strong> arm<br />
circumference (Table I.3) and four other anthropometric measures (height-for-age z-index,<br />
weight-for-age z-index, weight-for-height z-index, and body mass index). <strong>BRIGHT</strong> schools gave<br />
lunches to students through the canteens and gave girls with 90 percent attendance grain to take<br />
home but participation in the feeding programs was low. In addition, elementary-school-age<br />
children are less likely to respond to these programs compared to younger children in their very<br />
early years <strong>of</strong> life (Ainsworth and Ambel 2010).<br />
Finally, we found that <strong>BRIGHT</strong> modestly reduced the number <strong>of</strong> children engaged in six<br />
common household activities by 2.1 to 5.2 percentage points. This represents a reduction in 0.13<br />
standard deviations when the outcomes are compiled into a standardized composite labor index<br />
(Table I.3).<br />
Table I.3. Seven-year impacts <strong>of</strong> the <strong>BRIGHT</strong> program on enrollment and test<br />
scores<br />
Selected<br />
villages<br />
Unselected<br />
villages<br />
Estimated<br />
impacts<br />
Sample<br />
size<br />
Self-reported enrollment 47.7% 32.3% 15.4 pp*** 26,430<br />
Test scores 0.13 -0.16 0.29*** 23,464<br />
Arm circumference (mm) 162.59 161.86 0.74 25,982<br />
Overall labor index (standard deviation) -0.08 0.04 -0.13*** 25,081<br />
Sources: Mathematica household survey (2012) and Mathematica school survey (2012).<br />
Notes: Test scores are measured in standard deviations <strong>of</strong> student achievement.<br />
pp = Percentage points.<br />
***Coefficient statistically significant at the 1% significance level.<br />
10