Ten-Year Impacts of Burkina Faso’s BRIGHT Program
n?u=RePEc:mpr:mprres:2ecdd42bb503422b802ce20da2bf64b7&r=edu
n?u=RePEc:mpr:mprres:2ecdd42bb503422b802ce20da2bf64b7&r=edu

Create successful ePaper yourself
Turn your PDF publications into a flip-book with our unique Google optimized e-Paper software.
V. COST-EFFECTIVENESS AND COST-BENEFIT ANALYSIS MATHEMATICA POLICY RESEARCH<br />
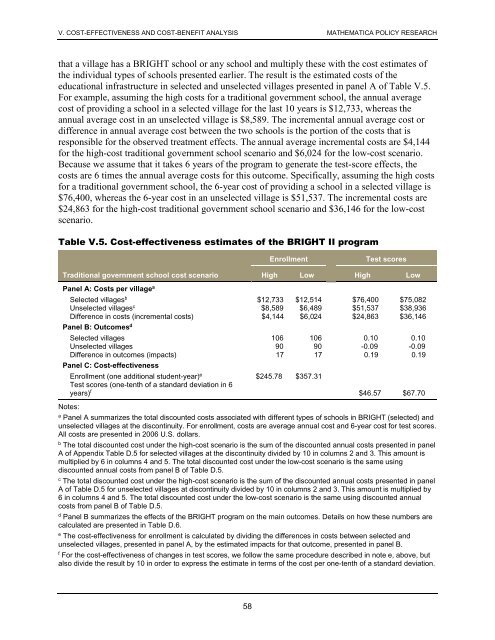
that a village has a <strong>BRIGHT</strong> school or any school and multiply these with the cost estimates <strong>of</strong><br />
the individual types <strong>of</strong> schools presented earlier. The result is the estimated costs <strong>of</strong> the<br />
educational infrastructure in selected and unselected villages presented in panel A <strong>of</strong> Table V.5.<br />
For example, assuming the high costs for a traditional government school, the annual average<br />
cost <strong>of</strong> providing a school in a selected village for the last 10 years is $12,733, whereas the<br />
annual average cost in an unselected village is $8,589. The incremental annual average cost or<br />
difference in annual average cost between the two schools is the portion <strong>of</strong> the costs that is<br />
responsible for the observed treatment effects. The annual average incremental costs are $4,144<br />
for the high-cost traditional government school scenario and $6,024 for the low-cost scenario.<br />
Because we assume that it takes 6 years <strong>of</strong> the program to generate the test-score effects, the<br />
costs are 6 times the annual average costs for this outcome. Specifically, assuming the high costs<br />
for a traditional government school, the 6-year cost <strong>of</strong> providing a school in a selected village is<br />
$76,400, whereas the 6-year cost in an unselected village is $51,537. The incremental costs are<br />
$24,863 for the high-cost traditional government school scenario and $36,146 for the low-cost<br />
scenario.<br />
Table V.5. Cost-effectiveness estimates <strong>of</strong> the <strong>BRIGHT</strong> II program<br />
Enrollment<br />
Test scores<br />
Traditional government school cost scenario High Low High Low<br />
Panel A: Costs per village a<br />
Selected villages b $12,733 $12,514 $76,400 $75,082<br />
Unselected villages c $8,589 $6,489 $51,537 $38,936<br />
Difference in costs (incremental costs) $4,144 $6,024 $24,863 $36,146<br />
Panel B: Outcomes d<br />
Selected villages 106 106 0.10 0.10<br />
Unselected villages 90 90 -0.09 -0.09<br />
Difference in outcomes (impacts) 17 17 0.19 0.19<br />
Panel C: Cost-effectiveness<br />
Enrollment (one additional student-year) e $245.78 $357.31<br />
Test scores (one-tenth <strong>of</strong> a standard deviation in 6<br />
years) f $46.57 $67.70<br />
Notes:<br />
a<br />
Panel A summarizes the total discounted costs associated with different types <strong>of</strong> schools in <strong>BRIGHT</strong> (selected) and<br />
unselected villages at the discontinuity. For enrollment, costs are average annual cost and 6-year cost for test scores.<br />
All costs are presented in 2006 U.S. dollars.<br />
b<br />
The total discounted cost under the high-cost scenario is the sum <strong>of</strong> the discounted annual costs presented in panel<br />
A <strong>of</strong> Appendix Table D.5 for selected villages at the discontinuity divided by 10 in columns 2 and 3. This amount is<br />
multiplied by 6 in columns 4 and 5. The total discounted cost under the low-cost scenario is the same using<br />
discounted annual costs from panel B <strong>of</strong> Table D.5.<br />
c<br />
The total discounted cost under the high-cost scenario is the sum <strong>of</strong> the discounted annual costs presented in panel<br />
A <strong>of</strong> Table D.5 for unselected villages at discontinuity divided by 10 in columns 2 and 3. This amount is multiplied by<br />
6 in columns 4 and 5. The total discounted cost under the low-cost scenario is the same using discounted annual<br />
costs from panel B <strong>of</strong> Table D.5.<br />
d<br />
Panel B summarizes the effects <strong>of</strong> the <strong>BRIGHT</strong> program on the main outcomes. Details on how these numbers are<br />
calculated are presented in Table D.6.<br />
e<br />
The cost-effectiveness for enrollment is calculated by dividing the differences in costs between selected and<br />
unselected villages, presented in panel A, by the estimated impacts for that outcome, presented in panel B.<br />
f<br />
For the cost-effectiveness <strong>of</strong> changes in test scores, we follow the same procedure described in note e, above, but<br />
also divide the result by 10 in order to express the estimate in terms <strong>of</strong> the cost per one-tenth <strong>of</strong> a standard deviation.<br />
58