Ten-Year Impacts of Burkina Faso’s BRIGHT Program
n?u=RePEc:mpr:mprres:2ecdd42bb503422b802ce20da2bf64b7&r=edu
n?u=RePEc:mpr:mprres:2ecdd42bb503422b802ce20da2bf64b7&r=edu

Create successful ePaper yourself
Turn your PDF publications into a flip-book with our unique Google optimized e-Paper software.
IV: FINDINGS<br />
MATHEMATICA POLICY RESEARCH<br />
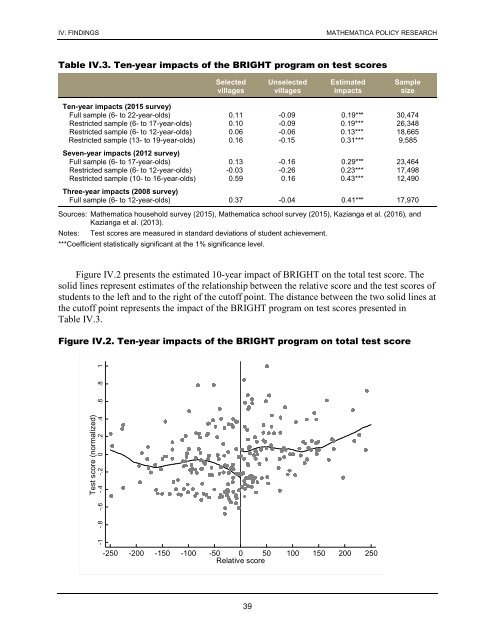
Table IV.3. <strong>Ten</strong>-year impacts <strong>of</strong> the <strong>BRIGHT</strong> program on test scores<br />
Selected<br />
villages<br />
Unselected<br />
villages<br />
Estimated<br />
impacts<br />
Sample<br />
size<br />
<strong>Ten</strong>-year impacts (2015 survey)<br />
Full sample (6- to 22-year-olds) 0.11 -0.09 0.19*** 30,474<br />
Restricted sample (6- to 17-year-olds) 0.10 -0.09 0.19*** 26,348<br />
Restricted sample (6- to 12-year-olds) 0.06 -0.06 0.13*** 18,665<br />
Restricted sample (13- to 19-year-olds) 0.16 -0.15 0.31*** 9,585<br />
Seven-year impacts (2012 survey)<br />
Full sample (6- to 17-year-olds) 0.13 -0.16 0.29*** 23,464<br />
Restricted sample (6- to 12-year-olds) -0.03 -0.26 0.23*** 17,498<br />
Restricted sample (10- to 16-year-olds) 0.59 0.16 0.43*** 12,490<br />
Three-year impacts (2008 survey)<br />
Full sample (6- to 12-year-olds) 0.37 -0.04 0.41*** 17,970<br />
Sources: Mathematica household survey (2015), Mathematica school survey (2015), Kazianga et al. (2016), and<br />
Kazianga et al. (2013).<br />
Notes:<br />
Test scores are measured in standard deviations <strong>of</strong> student achievement.<br />
***Coefficient statistically significant at the 1% significance level.<br />
Figure IV.2 presents the estimated 10-year impact <strong>of</strong> <strong>BRIGHT</strong> on the total test score. The<br />
solid lines represent estimates <strong>of</strong> the relationship between the relative score and the test scores <strong>of</strong><br />
students to the left and to the right <strong>of</strong> the cut<strong>of</strong>f point. The distance between the two solid lines at<br />
the cut<strong>of</strong>f point represents the impact <strong>of</strong> the <strong>BRIGHT</strong> program on test scores presented in<br />
Table IV.3.<br />
Figure IV.2. <strong>Ten</strong>-year impacts <strong>of</strong> the <strong>BRIGHT</strong> program on total test score<br />
Test score (normalized)<br />
-1 -.8 -.6 -.4 -.2 0 .2 .4 .6 .8 1<br />
-250 -200 -150 -100 -50 0 50 100 150 200 250<br />
Relative score<br />
39