Ten-Year Impacts of Burkina Faso’s BRIGHT Program
n?u=RePEc:mpr:mprres:2ecdd42bb503422b802ce20da2bf64b7&r=edu
n?u=RePEc:mpr:mprres:2ecdd42bb503422b802ce20da2bf64b7&r=edu

Create successful ePaper yourself
Turn your PDF publications into a flip-book with our unique Google optimized e-Paper software.
IV: FINDINGS<br />
MATHEMATICA POLICY RESEARCH<br />
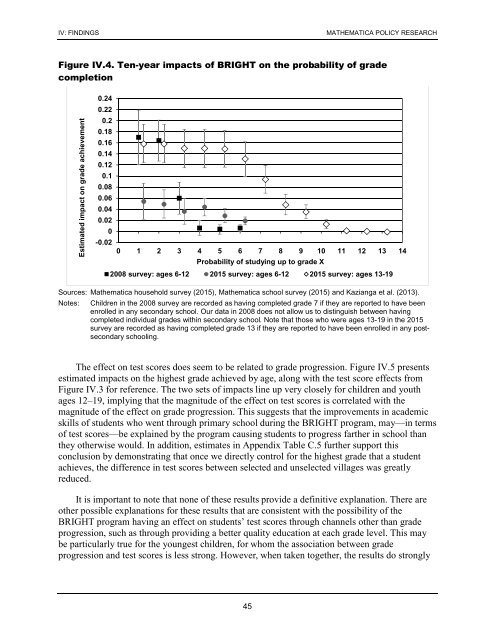
Figure IV.4. <strong>Ten</strong>-year impacts <strong>of</strong> <strong>BRIGHT</strong> on the probability <strong>of</strong> grade<br />
completion<br />
Estimated impact on grade achievement<br />
0.24<br />
0.22<br />
0.2<br />
0.18<br />
0.16<br />
0.14<br />
0.12<br />
0.1<br />
0.08<br />
0.06<br />
0.04<br />
0.02<br />
0<br />
-0.02<br />
0 1 2 3 4 5 6 7 8 9 10 11 12 13 14<br />
Probability <strong>of</strong> studying up to grade X<br />
2008 survey: ages 6-12 2015 survey: ages 6-12 2015 survey: ages 13-19<br />
Sources: Mathematica household survey (2015), Mathematica school survey (2015) and Kazianga et al. (2013).<br />
Notes:<br />
Children in the 2008 survey are recorded as having completed grade 7 if they are reported to have been<br />
enrolled in any secondary school. Our data in 2008 does not allow us to distinguish between having<br />
completed individual grades within secondary school. Note that those who were ages 13-19 in the 2015<br />
survey are recorded as having completed grade 13 if they are reported to have been enrolled in any postsecondary<br />
schooling.<br />
The effect on test scores does seem to be related to grade progression. Figure IV.5 presents<br />
estimated impacts on the highest grade achieved by age, along with the test score effects from<br />
Figure IV.3 for reference. The two sets <strong>of</strong> impacts line up very closely for children and youth<br />
ages 12–19, implying that the magnitude <strong>of</strong> the effect on test scores is correlated with the<br />
magnitude <strong>of</strong> the effect on grade progression. This suggests that the improvements in academic<br />
skills <strong>of</strong> students who went through primary school during the <strong>BRIGHT</strong> program, may—in terms<br />
<strong>of</strong> test scores—be explained by the program causing students to progress farther in school than<br />
they otherwise would. In addition, estimates in Appendix Table C.5 further support this<br />
conclusion by demonstrating that once we directly control for the highest grade that a student<br />
achieves, the difference in test scores between selected and unselected villages was greatly<br />
reduced.<br />
It is important to note that none <strong>of</strong> these results provide a definitive explanation. There are<br />
other possible explanations for these results that are consistent with the possibility <strong>of</strong> the<br />
<strong>BRIGHT</strong> program having an effect on students’ test scores through channels other than grade<br />
progression, such as through providing a better quality education at each grade level. This may<br />
be particularly true for the youngest children, for whom the association between grade<br />
progression and test scores is less strong. However, when taken together, the results do strongly<br />
45