Ten-Year Impacts of Burkina Faso’s BRIGHT Program
n?u=RePEc:mpr:mprres:2ecdd42bb503422b802ce20da2bf64b7&r=edu
n?u=RePEc:mpr:mprres:2ecdd42bb503422b802ce20da2bf64b7&r=edu

Create successful ePaper yourself
Turn your PDF publications into a flip-book with our unique Google optimized e-Paper software.
IV: FINDINGS<br />
MATHEMATICA POLICY RESEARCH<br />
decreases for higher grades after primary school. In addition, we show in results presented in<br />
Appendix C (Table C.5) that statistically controlling for either the age <strong>of</strong> the school or the<br />
number <strong>of</strong> grades <strong>of</strong>fered does not diminish the observed treatment effect on test scores. This<br />
indicates that even within villages which have had a school for the same number <strong>of</strong> years or<br />
which <strong>of</strong>fer the same grade levels, the <strong>BRIGHT</strong> program still causes students in selected villages<br />
to have higher test scores.<br />
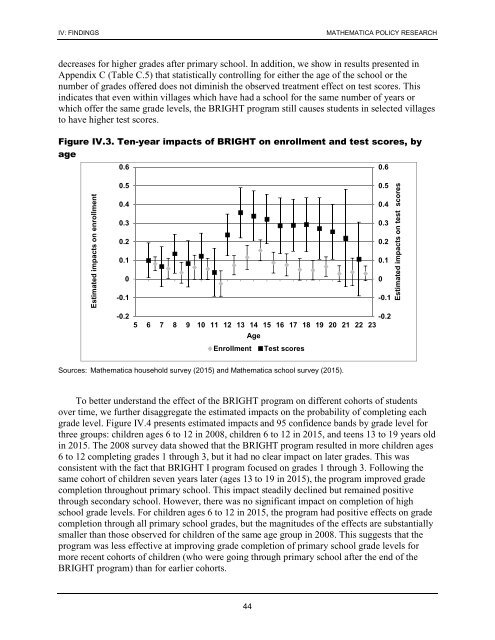
Figure IV.3. <strong>Ten</strong>-year impacts <strong>of</strong> <strong>BRIGHT</strong> on enrollment and test scores, by<br />
age<br />
0.6<br />
0.6<br />
Estimated impacts on enrollment<br />
0.5<br />
0.4<br />
0.3<br />
0.2<br />
0.1<br />
0<br />
-0.1<br />
-0.2<br />
0.5<br />
0.4<br />
0.3<br />
0.2<br />
0.1<br />
0<br />
-0.1<br />
-0.2<br />
5 6 7 8 9 10 11 12 13 14 15 16 17 18 19 20 21 22 23<br />
Age<br />
Enrollment Test scores<br />
Estimated impacts on test scores<br />
Sources: Mathematica household survey (2015) and Mathematica school survey (2015).<br />
To better understand the effect <strong>of</strong> the <strong>BRIGHT</strong> program on different cohorts <strong>of</strong> students<br />
over time, we further disaggregate the estimated impacts on the probability <strong>of</strong> completing each<br />
grade level. Figure IV.4 presents estimated impacts and 95 confidence bands by grade level for<br />
three groups: children ages 6 to 12 in 2008, children 6 to 12 in 2015, and teens 13 to 19 years old<br />
in 2015. The 2008 survey data showed that the <strong>BRIGHT</strong> program resulted in more children ages<br />
6 to 12 completing grades 1 through 3, but it had no clear impact on later grades. This was<br />
consistent with the fact that <strong>BRIGHT</strong> I program focused on grades 1 through 3. Following the<br />
same cohort <strong>of</strong> children seven years later (ages 13 to 19 in 2015), the program improved grade<br />
completion throughout primary school. This impact steadily declined but remained positive<br />
through secondary school. However, there was no significant impact on completion <strong>of</strong> high<br />
school grade levels. For children ages 6 to 12 in 2015, the program had positive effects on grade<br />
completion through all primary school grades, but the magnitudes <strong>of</strong> the effects are substantially<br />
smaller than those observed for children <strong>of</strong> the same age group in 2008. This suggests that the<br />
program was less effective at improving grade completion <strong>of</strong> primary school grade levels for<br />
more recent cohorts <strong>of</strong> children (who were going through primary school after the end <strong>of</strong> the<br />
<strong>BRIGHT</strong> program) than for earlier cohorts.<br />
44