Ten-Year Impacts of Burkina Faso’s BRIGHT Program
n?u=RePEc:mpr:mprres:2ecdd42bb503422b802ce20da2bf64b7&r=edu
n?u=RePEc:mpr:mprres:2ecdd42bb503422b802ce20da2bf64b7&r=edu

Create successful ePaper yourself
Turn your PDF publications into a flip-book with our unique Google optimized e-Paper software.
IV: FINDINGS<br />
MATHEMATICA POLICY RESEARCH<br />
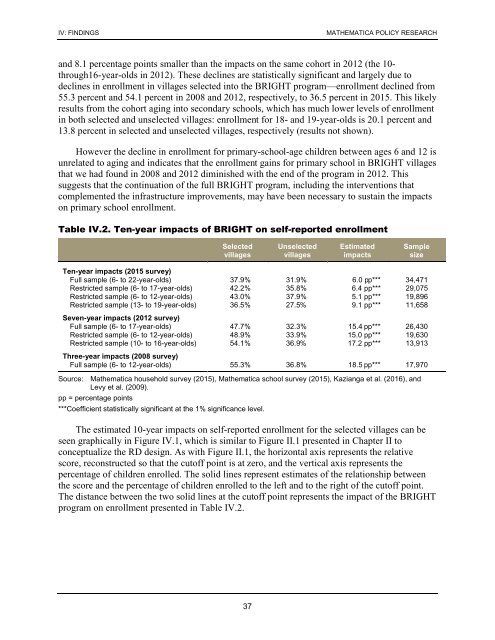
and 8.1 percentage points smaller than the impacts on the same cohort in 2012 (the 10-<br />
through16-year-olds in 2012). These declines are statistically significant and largely due to<br />
declines in enrollment in villages selected into the <strong>BRIGHT</strong> program—enrollment declined from<br />
55.3 percent and 54.1 percent in 2008 and 2012, respectively, to 36.5 percent in 2015. This likely<br />
results from the cohort aging into secondary schools, which has much lower levels <strong>of</strong> enrollment<br />
in both selected and unselected villages: enrollment for 18- and 19-year-olds is 20.1 percent and<br />
13.8 percent in selected and unselected villages, respectively (results not shown).<br />
However the decline in enrollment for primary-school-age children between ages 6 and 12 is<br />
unrelated to aging and indicates that the enrollment gains for primary school in <strong>BRIGHT</strong> villages<br />
that we had found in 2008 and 2012 diminished with the end <strong>of</strong> the program in 2012. This<br />
suggests that the continuation <strong>of</strong> the full <strong>BRIGHT</strong> program, including the interventions that<br />
complemented the infrastructure improvements, may have been necessary to sustain the impacts<br />
on primary school enrollment.<br />
Table IV.2. <strong>Ten</strong>-year impacts <strong>of</strong> <strong>BRIGHT</strong> on self-reported enrollment<br />
Selected<br />
villages<br />
Unselected<br />
villages<br />
Estimated<br />
impacts<br />
Sample<br />
size<br />
<strong>Ten</strong>-year impacts (2015 survey)<br />
Full sample (6- to 22-year-olds) 37.9% 31.9% 6.0 pp*** 34,471<br />
Restricted sample (6- to 17-year-olds) 42.2% 35.8% 6.4 pp*** 29,075<br />
Restricted sample (6- to 12-year-olds) 43.0% 37.9% 5.1 pp*** 19,896<br />
Restricted sample (13- to 19-year-olds) 36.5% 27.5% 9.1 pp*** 11,658<br />
Seven-year impacts (2012 survey)<br />
Full sample (6- to 17-year-olds) 47.7% 32.3% 15.4 pp*** 26,430<br />
Restricted sample (6- to 12-year-olds) 48.9% 33.9% 15.0 pp*** 19,630<br />
Restricted sample (10- to 16-year-olds) 54.1% 36.9% 17.2 pp*** 13,913<br />
Three-year impacts (2008 survey)<br />
Full sample (6- to 12-year-olds) 55.3% 36.8% 18.5 pp*** 17,970<br />
Source: Mathematica household survey (2015), Mathematica school survey (2015), Kazianga et al. (2016), and<br />
Levy et al. (2009).<br />
pp = percentage points<br />
***Coefficient statistically significant at the 1% significance level.<br />
The estimated 10-year impacts on self-reported enrollment for the selected villages can be<br />
seen graphically in Figure IV.1, which is similar to Figure II.1 presented in Chapter II to<br />
conceptualize the RD design. As with Figure II.1, the horizontal axis represents the relative<br />
score, reconstructed so that the cut<strong>of</strong>f point is at zero, and the vertical axis represents the<br />
percentage <strong>of</strong> children enrolled. The solid lines represent estimates <strong>of</strong> the relationship between<br />
the score and the percentage <strong>of</strong> children enrolled to the left and to the right <strong>of</strong> the cut<strong>of</strong>f point.<br />
The distance between the two solid lines at the cut<strong>of</strong>f point represents the impact <strong>of</strong> the <strong>BRIGHT</strong><br />
program on enrollment presented in Table IV.2.<br />
37