

URBANIZATION AND INDUSTRIALIZATION
Economic%20Report%20on%20Africa%202017%20UNECA
Economic%20Report%20on%20Africa%202017%20UNECA

Create successful ePaper yourself
Turn your PDF publications into a flip-book with our unique Google optimized e-Paper software.
3.7 NATURAL RESOURCE–BASED GROWTH <strong>AND</strong><br />
CONSUMPTION CITIES<br />
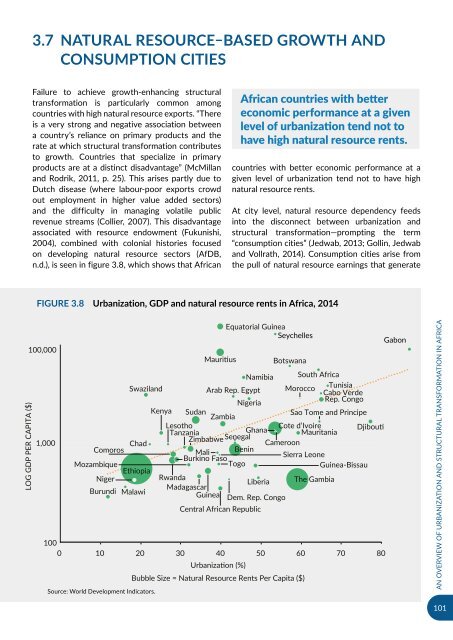
Failure to achieve growth-enhancing structural<br />
transformation is particularly common among<br />
countries with high natural resource exports. “There<br />
is a very strong and negative association between<br />
a country’s reliance on primary products and the<br />
rate at which structural transformation contributes<br />
to growth. Countries that specialize in primary<br />
products are at a distinct disadvantage” (McMillan<br />
and Rodrik, 2011, p. 25). This arises partly due to<br />
Dutch disease (where labour-poor exports crowd<br />
out employment in higher value added sectors)<br />
and the difficulty in managing volatile public<br />
revenue streams (Collier, 2007). This disadvantage<br />
associated with resource endowment (Fukunishi,<br />
2004), combined with colonial histories focused<br />
on developing natural resource sectors (AfDB,<br />
n.d.), is seen in figure 3.8, which shows that African<br />
African countries with better<br />
economic performance at a given<br />
level of urbanization tend not to<br />
have high natural resource rents.<br />
countries with better economic performance at a<br />
given level of urbanization tend not to have high<br />
natural resource rents.<br />
At city level, natural resource dependency feeds<br />
into the disconnect between urbanization and<br />
structural transformation—prompting the term<br />
“consumption cities” (Jedwab, 2013; Gollin, Jedwab<br />
and Vollrath, 2014). Consumption cities arise from<br />
the pull of natural resource earnings that generate<br />
Figure 3.8 Urbanization, GDP and natural resource rents in Africa, 2014<br />
LOG GDP PER CAPITA ($)<br />
100,000<br />
1,000<br />
Mauritius<br />
Botswana<br />
Namibia South Africa<br />
Swaziland<br />
Arab Rep. Egypt Morocco<br />
Tunisia<br />
Cabo Verde<br />
Nigeria<br />
Rep. Congo<br />
Kenya Sudan<br />
Sao Tome and Principe<br />
Zambia<br />
Lesotho<br />
Cote d’Ivoire Djibouti<br />
Tanzania<br />
Ghana Mauritania<br />
Zimbabwe<br />
Chad<br />
Senegal Cameroon<br />
Comoros<br />
Mali<br />
Benin<br />
Burkino Faso<br />
Sierra Leone<br />
Mozambique<br />
Togo<br />
Guinea-Bissau<br />
Ethiopia<br />
Niger<br />
Rwanda<br />
Liberia The Gambia<br />
Madagascar<br />
Burundi Malawi<br />
Guinea Dem. Rep. Congo<br />
Central African Republic<br />
100<br />
0 10 20 30 40 50 60 70 80<br />
Source: World Development Indicators.<br />
Urbanization (%)<br />
Equatorial Guinea<br />
Seychelles<br />
Bubble Size = Natural Resource Rents Per Capita ($)<br />
Gabon<br />
AN OVERVIEW OF <strong>URBANIZATION</strong> <strong>AND</strong> STRUCTURAL TRANSFORMATION IN AFRICA<br />
101