

URBANIZATION AND INDUSTRIALIZATION
Economic%20Report%20on%20Africa%202017%20UNECA
Economic%20Report%20on%20Africa%202017%20UNECA

You also want an ePaper? Increase the reach of your titles
YUMPU automatically turns print PDFs into web optimized ePapers that Google loves.
HIGH INITIAL INEQUALITY<br />
The period of sustained growth in most countries<br />
in Africa has boosted per capita incomes, reduced<br />
poverty and led to steady progress in education,<br />
health and living standards. But the pace of progress<br />
is slow, hampered by high levels of income inequality<br />
within countries. Economic growth delivers less<br />
poverty reduction when initial inequality is high<br />
because the absolute increases in income associated<br />
with rising average incomes are smaller for the<br />
bottom quintiles (Chandy, 2015).<br />
Three features characterize the inequality landscape<br />
in Africa:<br />
HIGH AVERAGE INEQUALITY<br />
The unweighted average Gini coefficient<br />
in Africa is 0.44, which is the second highest after<br />
the Gini in Latin America (around 0.50), and nearly<br />
12 per cent higher than the coefficient for the rest<br />
of the developing world, at 0.39. Seven of the 10<br />
most unequal countries in the world are in Africa<br />
(AfDB, OECD and UNDP, 2016). The average withincountry<br />
inequality masks wide-ranging variation<br />
from 0.31 in Egypt and Niger to 0.65 in South Africa<br />
and 0.66 in Seychelles (figure 2.5).<br />
EXTREME INEQUALITY<br />
South Africa, Namibia and Botswana are among the<br />
most unequal countries in the world, with the Gini<br />
exceeding 0.60 in 2013. Around 10 per cent of the<br />
African population live in highly unequal countries<br />
with the Gini in excess of 0.50 (shown in green in<br />
figure 2.5). A further 50 per cent live in countries<br />
with the Gini in the range of 0.40 to 0.50. In short,<br />
close to 60 per cent of the African population live in<br />
countries with very high to high levels of inequality.<br />
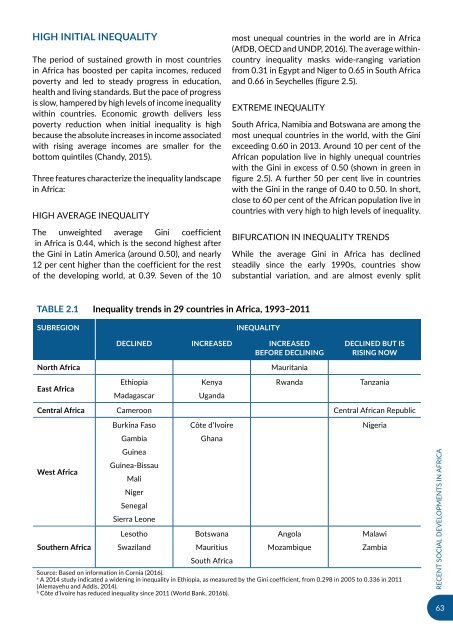
BIFURCATION IN INEQUALITY TRENDS<br />
While the average Gini in Africa has declined<br />
steadily since the early 1990s, countries show<br />
substantial variation, and are almost evenly split<br />
Table 2.1 Inequality trends in 29 countries in Africa, 1993–2011<br />
SUBREGION<br />
INEQUALITY<br />
DECLINED INCREASED INCREASED<br />
BEFORE DECLINING<br />
DECLINED BUT IS<br />
RISING NOW<br />
North Africa<br />
Mauritania<br />
East Africa<br />
Ethiopia<br />
Madagascar<br />
Kenya<br />
Uganda<br />
Rwanda<br />
Tanzania<br />
Central Africa Cameroon Central African Republic<br />
West Africa<br />
Southern Africa<br />
Burkina Faso<br />
Gambia<br />
Guinea<br />
Guinea-Bissau<br />
Mali<br />
Niger<br />
Senegal<br />
Sierra Leone<br />
Lesotho<br />
Swaziland<br />
Côte d’Ivoire<br />
Ghana<br />
Botswana<br />
Mauritius<br />
South Africa<br />
Angola<br />
Mozambique<br />
Nigeria<br />
Malawi<br />
Zambia<br />
Source: Based on information in Cornia (2016).<br />
a<br />
A 2014 study indicated a widening in inequality in Ethiopia, as measured by the Gini coefficient, from 0.298 in 2005 to 0.336 in 2011<br />
(Alemayehu and Addis, 2014).<br />
b<br />
Côte d’Ivoire has reduced inequality since 2011 (World Bank, 2016b).<br />
RECENT SOCIAL DEVELOPMENTS IN AFRICA<br />
63