

URBANIZATION AND INDUSTRIALIZATION
Economic%20Report%20on%20Africa%202017%20UNECA
Economic%20Report%20on%20Africa%202017%20UNECA

You also want an ePaper? Increase the reach of your titles
YUMPU automatically turns print PDFs into web optimized ePapers that Google loves.
are seeking to finance public investment and are<br />
increasingly relying on non-concessional borrowing<br />
(Prizzon and Mustapha, 2014). Most of them have<br />
entered the international capital markets, selling<br />
Eurobonds usually denominated in dollars or euros.<br />
Before 2006 only South Africa had issued a foreign<br />
currency–denominated sovereign bond in Africa,<br />
but in 2006–2014 at least 14 countries issued about<br />
$15 billion in international sovereign bonds. 12<br />
Though the international bond market is an<br />
opportunity for new sources of external finance for<br />
African economies, often without the imposition<br />
of conditions, it is not without issues. Servicing<br />
such bonds can be problematic for prudent debt<br />
management, including interest rate and foreign<br />
exchange risks. With a rise in international interest<br />
rates, countries that have borrowed on international<br />
markets could see exchange rate changes raise<br />
their debt repayments in local currency terms. So<br />
although interest rates on domestic debt are much<br />
higher at, on average, 19–23 per cent (UNCTAD,<br />
2016d), exchange rate devaluation or depreciation<br />
narrows the nominal difference between the two<br />
rates (te Velde, 2014). Similarly, unlike bank loans,<br />
international sovereign bonds may be more difficult<br />
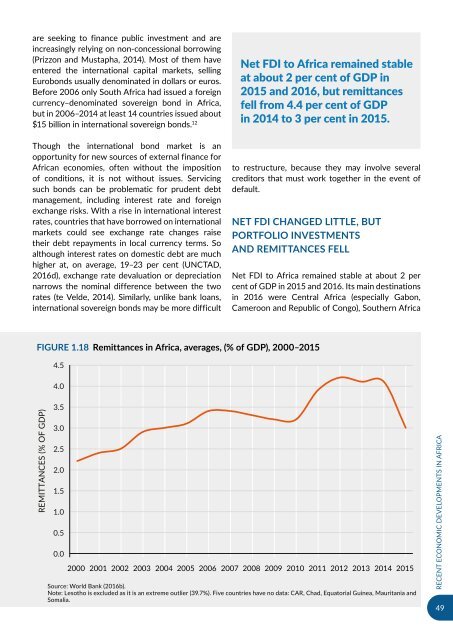
Net FDI to Africa remained stable<br />
at about 2 per cent of GDP in<br />
2015 and 2016, but remittances<br />
fell from 4.4 per cent of GDP<br />
in 2014 to 3 per cent in 2015.<br />
to restructure, because they may involve several<br />
creditors that must work together in the event of<br />
default.<br />
NET FDI CHANGED LITTLE, BUT<br />
PORTFOLIO INVESTMENTS<br />
<strong>AND</strong> REMITTANCES FELL<br />
Net FDI to Africa remained stable at about 2 per<br />
cent of GDP in 2015 and 2016. Its main destinations<br />
in 2016 were Central Africa (especially Gabon,<br />
Cameroon and Republic of Congo), Southern Africa<br />
Figure 1.18 Remittances in Africa, averages, (% of GDP), 2000–2015<br />
4.5<br />
4.0<br />
REMITTANCES (% OF GDP)<br />
3.5<br />
3.0<br />
2.5<br />
2.0<br />
1.5<br />
1.0<br />
0.5<br />
0.0<br />
2000 2001 2002 2003 2004 2005 2006 2007 2008 2009 2010 2011 2012 2013 2014 2015<br />
Source: World Bank (2016b).<br />
Note: Lesotho is excluded as it is an extreme outlier (39.7%). Five countries have no data: CAR, Chad, Equatorial Guinea, Mauritania and<br />
Somalia.<br />
RECENT ECONOMIC DEVELOPMENTS IN AFRICA<br />
49