

URBANIZATION AND INDUSTRIALIZATION
Economic%20Report%20on%20Africa%202017%20UNECA
Economic%20Report%20on%20Africa%202017%20UNECA

Create successful ePaper yourself
Turn your PDF publications into a flip-book with our unique Google optimized e-Paper software.
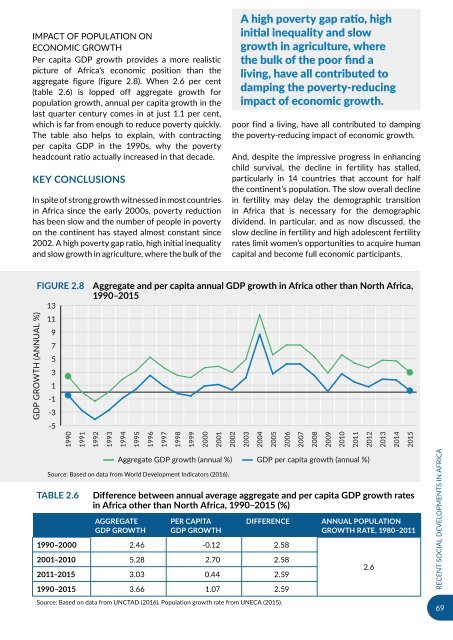
IMPACT OF POPULATION ON<br />
ECONOMIC GROWTH<br />
Per capita GDP growth provides a more realistic<br />
picture of Africa’s economic position than the<br />
aggregate figure (figure 2.8). When 2.6 per cent<br />
(table 2.6) is lopped off aggregate growth for<br />
population growth, annual per capita growth in the<br />
last quarter century comes in at just 1.1 per cent,<br />
which is far from enough to reduce poverty quickly.<br />
The table also helps to explain, with contracting<br />
per capita GDP in the 1990s, why the poverty<br />
headcount ratio actually increased in that decade.<br />
KEY CONCLUSIONS<br />
In spite of strong growth witnessed in most countries<br />
in Africa since the early 2000s, poverty reduction<br />
has been slow and the number of people in poverty<br />
on the continent has stayed almost constant since<br />
2002. A high poverty gap ratio, high initial inequality<br />
and slow growth in agriculture, where the bulk of the<br />
A high poverty gap ratio, high<br />
initial inequality and slow<br />
growth in agriculture, where<br />
the bulk of the poor find a<br />
living, have all contributed to<br />
damping the poverty-reducing<br />
impact of economic growth.<br />
poor find a living, have all contributed to damping<br />
the poverty-reducing impact of economic growth.<br />
And, despite the impressive progress in enhancing<br />
child survival, the decline in fertility has stalled,<br />
particularly in 14 countries that account for half<br />
the continent’s population. The slow overall decline<br />
in fertility may delay the demographic transition<br />
in Africa that is necessary for the demographic<br />
dividend. In particular, and as now discussed, the<br />
slow decline in fertility and high adolescent fertility<br />
rates limit women’s opportunities to acquire human<br />
capital and become full economic participants.<br />
GDP GROWTH (ANNUAL %)<br />
Figure 2.8 Aggregate and per capita annual GDP growth in Africa other than North Africa,<br />
1990–2015<br />
13<br />
11<br />
9<br />
7<br />
5<br />
3<br />
1<br />
-1<br />
-3<br />
-5<br />
1990<br />
1991<br />
1992<br />
1993<br />
1994<br />
1995<br />
1996<br />
1997<br />
1998<br />
1999<br />
2000<br />
2001<br />
2002<br />
2003<br />
2004<br />
2005<br />
2006<br />
2007<br />
2008<br />
2009<br />
2010<br />
2011<br />
2012<br />
2013<br />
2014<br />
2015<br />
Table 2.6<br />
Aggregate GDP growth (annual %) GDP per capita growth (annual %)<br />
Source: Based on data from World Development Indicators (2016).<br />
Difference between annual average aggregate and per capita GDP growth rates<br />
in Africa other than North Africa, 1990–2015 (%)<br />
AGGREGATE<br />
GDP GROWTH<br />
PER CAPITA<br />
GDP GROWTH<br />
DIFFERENCE<br />
1990–2000 2.46 -0.12 2.58<br />
2001–2010 5.28 2.70 2.58<br />
2011–2015 3.03 0.44 2.59<br />
1990–2015 3.66 1.07 2.59<br />
Source: Based on data from UNCTAD (2016). Population growth rate from UNECA (2015).<br />
ANNUAL POPULATION<br />
GROWTH RATE, 1980–2011<br />
2.6<br />
RECENT SOCIAL DEVELOPMENTS IN AFRICA<br />
69