

URBANIZATION AND INDUSTRIALIZATION
Economic%20Report%20on%20Africa%202017%20UNECA
Economic%20Report%20on%20Africa%202017%20UNECA

You also want an ePaper? Increase the reach of your titles
YUMPU automatically turns print PDFs into web optimized ePapers that Google loves.
160<br />
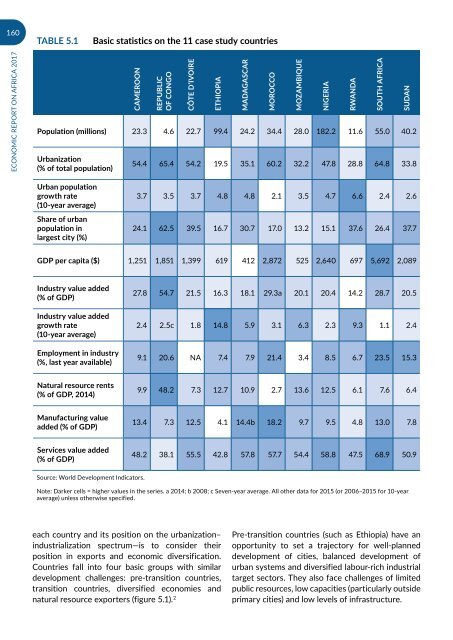
Table 5.1<br />
Basic statistics on the 11 case study countries<br />
ECONOMIC REPORT ON AFRICA 2017<br />
CAMEROON<br />
REPUBLIC<br />
OF CONGO<br />
CÔTE D’IVOIRE<br />
ETHIOPIA<br />
Population (millions) 23.3 4.6 22.7 99.4 24.2 34.4 28.0 182.2 11.6 55.0 40.2<br />
Urbanization<br />
(% of total population)<br />
MADAGASCAR<br />
MOROCCO<br />
54.4 65.4 54.2 19.5 35.1 60.2 32.2 47.8 28.8 64.8 33.8<br />
MOZAMBIQUE<br />
NIGERIA<br />
RW<strong>AND</strong>A<br />
SOUTH AFRICA<br />
SUDAN<br />
Urban population<br />
growth rate<br />
(10-year average)<br />
Share of urban<br />
population in<br />
largest city (%)<br />
3.7 3.5 3.7 4.8 4.8 2.1 3.5 4.7 6.6 2.4 2.6<br />
24.1 62.5 39.5 16.7 30.7 17.0 13.2 15.1 37.6 26.4 37.7<br />
GDP per capita ($) 1,251 1,851 1,399 619 412 2,872 525 2,640 697 5,692 2,089<br />
Industry value added<br />
(% of GDP)<br />
Industry value added<br />
growth rate<br />
(10-year average)<br />
Employment in industry<br />
(%, last year available)<br />
27.8 54.7 21.5 16.3 18.1 29.3a 20.1 20.4 14.2 28.7 20.5<br />
2.4 2.5c 1.8 14.8 5.9 3.1 6.3 2.3 9.3 1.1 2.4<br />
9.1 20.6 NA 7.4 7.9 21.4 3.4 8.5 6.7 23.5 15.3<br />
Natural resource rents<br />
(% of GDP, 2014)<br />
9.9 48.2 7.3 12.7 10.9 2.7 13.6 12.5 6.1 7.6 6.4<br />
Manufacturing value<br />
added (% of GDP)<br />
13.4 7.3 12.5 4.1 14.4b 18.2 9.7 9.5 4.8 13.0 7.8<br />
Services value added<br />
(% of GDP)<br />
48.2 38.1 55.5 42.8 57.8 57.7 54.4 58.8 47.5 68.9 50.9<br />
Source: World Development Indicators.<br />
Note: Darker cells = higher values in the series. a 2014; b 2008; c Seven-year average. All other data for 2015 (or 2006–2015 for 10-year<br />
average) unless otherwise specified.<br />
each country and its position on the urbanization–<br />
industrialization spectrum—is to consider their<br />
position in exports and economic diversification.<br />
Countries fall into four basic groups with similar<br />
development challenges: pre-transition countries,<br />
transition countries, diversified economies and<br />
natural resource exporters (figure 5.1). 2<br />
Pre-transition countries (such as Ethiopia) have an<br />
opportunity to set a trajectory for well-planned<br />
development of cities, balanced development of<br />
urban systems and diversified labour-rich industrial<br />
target sectors. They also face challenges of limited<br />
public resources, low capacities (particularly outside<br />
primary cities) and low levels of infrastructure.