

URBANIZATION AND INDUSTRIALIZATION
Economic%20Report%20on%20Africa%202017%20UNECA
Economic%20Report%20on%20Africa%202017%20UNECA

You also want an ePaper? Increase the reach of your titles
YUMPU automatically turns print PDFs into web optimized ePapers that Google loves.
median grade attained for 15–19 year olds is 3 or<br />
more for the bottom quintile, which narrows or<br />
even vanishes at the top quintile, as in Benin, DRC,<br />
Gambia and Togo (World Bank, 2012).<br />
HEALTH<br />
An important measure of women’s status is life<br />
expectancy at birth. Drawing on cross-country data,<br />
figure 2.12 shows that women’s life expectancy<br />
patterns are similar to those of women’s education:<br />
life expectancy rises with income. But this result<br />
should be interpreted with caution as the data are<br />
very “noisy”—women in Equatorial Guinea (with a<br />
per capita GNI of $21,056) and DRC ($680) have<br />
similar life expectancies.<br />
A parallel analysis finds that female life expectancy<br />
improves relative to male life expectancy as<br />
incomes rise; female life expectancy on average is<br />
about three years longer than male life expectancy,<br />
though again with wide variations. In Mauritius<br />
women’s life expectancy is more than seven years<br />
longer than men’s. In Libya and Rwanda the female<br />
life expectancy is higher than the male by 5.7 and<br />
5.9 years, respectively (UNDP, 2015).<br />
Two countries—Mali and Swaziland—have higher<br />
male than female life expectancy, which suggests<br />
lack of access to suitable health care by women.<br />
Mali is in West Africa, which is also the subregion<br />
with the lowest average mean years of schooling for<br />
women and, until recently, had the largest gender<br />
gap in primary completion rates (see table 2.7).<br />
There is an Africa-wide gender<br />
gap as women receive on average<br />
4.3 mean years of schooling,<br />
against men who get 5.7 years.<br />
These points together suggest that women in West<br />
Africa are particularly disadvantaged. And unlike<br />
countries where the gender life expectancy gap<br />
rises with income, there is little difference in that<br />
gap in African countries as income rises.<br />
WOMEN’S PARTICIPATION<br />
IN THE LABOUR FORCE<br />
Women’s participation in the labour market varies<br />
greatly across countries worldwide, reflecting<br />
differences in economic development, social norms,<br />
education levels, fertility rates and access to child<br />
care and other support services. The relationship<br />
between the female labour force participation rate<br />
(FLFPR) and these factors is complex but critical<br />
because the FLFPR is a driver of growth, and<br />
indicates a country’s potential to grow more rapidly<br />
(Verick, 2014).<br />
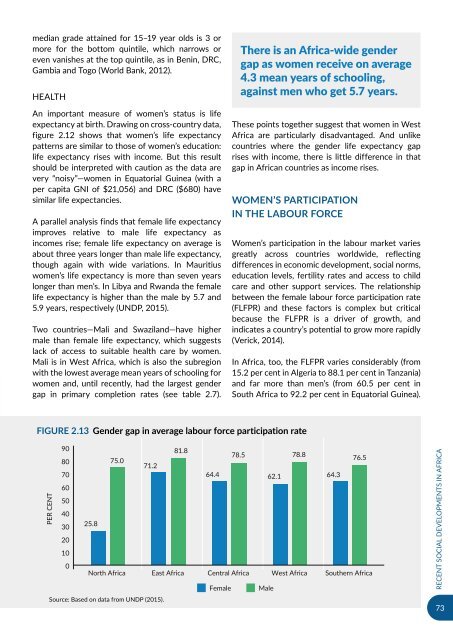
In Africa, too, the FLFPR varies considerably (from<br />
15.2 per cent in Algeria to 88.1 per cent in Tanzania)<br />
and far more than men’s (from 60.5 per cent in<br />
South Africa to 92.2 per cent in Equatorial Guinea).<br />
Figure 2.13 Gender gap in average labour force participation rate<br />
PER CENT<br />
90<br />
81.8<br />
80<br />
75.0<br />
71.2<br />
78.5 78.8<br />
76.5<br />
70<br />
64.4 62.1 64.3<br />
60<br />
50<br />
40<br />
30<br />
25.8<br />
20<br />
10<br />
0<br />
North Africa East Africa Central Africa West Africa Southern Africa<br />
Female Male<br />
Source: Based on data from UNDP (2015).<br />
RECENT SOCIAL DEVELOPMENTS IN AFRICA<br />
73