Comprehensive geriatric assessment for older adults admitted to ...
Comprehensive geriatric assessment for older adults admitted to ...
Comprehensive geriatric assessment for older adults admitted to ...
Create successful ePaper yourself
Turn your PDF publications into a flip-book with our unique Google optimized e-Paper software.
esults are only reported where significant subgroup interaction<br />
exists.<br />
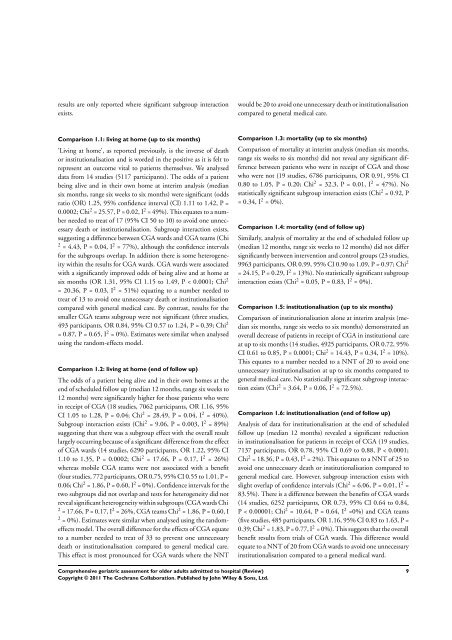
Comparison 1.1: living at home (up <strong>to</strong> six months)<br />
’Living at home’, as reported previously, is the inverse of death<br />
or institutionalisation and is worded in the positive as it is felt <strong>to</strong><br />
represent an outcome vital <strong>to</strong> patients themselves. We analysed<br />
data from 14 studies (5117 participants). The odds of a patient<br />
being alive and in their own home at interim analysis (median<br />
six months, range six weeks <strong>to</strong> six months) were significant (odds<br />
ratio (OR) 1.25, 95% confidence interval (CI) 1.11 <strong>to</strong> 1.42, P =<br />
0.0002; Chi 2 = 25.57, P = 0.02, I 2 = 49%). This equates <strong>to</strong> a number<br />
needed <strong>to</strong> treat of 17 (95% CI 50 <strong>to</strong> 10) <strong>to</strong> avoid one unnecessary<br />
death or institutionalisation. Subgroup interaction exists,<br />
suggesting a difference between CGA wards and CGA teams (Chi<br />
2 = 4.43, P = 0.04, I 2 = 77%), although the confidence intervals<br />
<strong>for</strong> the subgroups overlap. In addition there is some heterogeneity<br />
within the results <strong>for</strong> CGA wards. CGA wards were associated<br />
with a significantly improved odds of being alive and at home at<br />
six months (OR 1.31, 95% CI 1.15 <strong>to</strong> 1.49, P < 0.0001; Chi 2<br />
= 20.36, P = 0.03, I 2 = 51%) equating <strong>to</strong> a number needed <strong>to</strong><br />
treat of 13 <strong>to</strong> avoid one unnecessary death or institutionalisation<br />
compared with general medical care. By contrast, results <strong>for</strong> the<br />
smaller CGA teams subgroup were not significant (three studies,<br />
493 participants, OR 0.84, 95% CI 0.57 <strong>to</strong> 1.24, P = 0.39; Chi 2<br />
= 0.87, P = 0.65, I 2 = 0%). Estimates were similar when analysed<br />
using the random-effects model.<br />
Comparison 1.2: living at home (end of follow up)<br />
The odds of a patient being alive and in their own homes at the<br />
end of scheduled follow up (median 12 months, range six weeks <strong>to</strong><br />
12 months) were significantly higher <strong>for</strong> those patients who were<br />
in receipt of CGA (18 studies, 7062 participants, OR 1.16, 95%<br />
CI 1.05 <strong>to</strong> 1.28, P = 0.04; Chi 2 = 28.49, P = 0.04, I 2 = 40%).<br />
Subgroup interaction exists (Chi 2 = 9.06, P = 0.003, I 2 = 89%)<br />
suggesting that there was a subgroup effect with the overall result<br />
largely occurring because of a significant difference from the effect<br />
of CGA wards (14 studies, 6290 participants, OR 1.22, 95% CI<br />
1.10 <strong>to</strong> 1.35, P = 0.0002; Chi 2 = 17.66, P = 0.17, I 2 = 26%)<br />
whereas mobile CGA teams were not associated with a benefit<br />
(four studies, 772 participants, OR 0.75, 95% CI 0.55 <strong>to</strong> 1.01, P =<br />
0.06; Chi 2 = 1.86, P = 0.60, I 2 = 0%). Confidence intervals <strong>for</strong> the<br />
two subgroups did not overlap and tests <strong>for</strong> heterogeneity did not<br />
reveal significant heterogeneity within subgroups (CGA wards Chi<br />
2 = 17.66, P = 0.17, I 2 = 26%, CGA teams Chi 2 = 1.86, P = 0.60, I<br />
2 = 0%). Estimates were similar when analysed using the randomeffects<br />
model. The overall difference <strong>for</strong> the effects of CGA equate<br />
<strong>to</strong> a number needed <strong>to</strong> treat of 33 <strong>to</strong> prevent one unnecessary<br />
death or institutionalisation compared <strong>to</strong> general medical care.<br />
This effect is most pronounced <strong>for</strong> CGA wards where the NNT<br />
<strong>Comprehensive</strong> <strong>geriatric</strong> <strong>assessment</strong> <strong>for</strong> <strong>older</strong> <strong>adults</strong> <strong>admitted</strong> <strong>to</strong> hospital (Review)<br />
Copyright © 2011 The Cochrane Collaboration. Published by John Wiley & Sons, Ltd.<br />
would be 20 <strong>to</strong> avoid one unnecessary death or institutionalisation<br />
compared <strong>to</strong> general medical care.<br />
Comparison 1.3: mortality (up <strong>to</strong> six months)<br />
Comparison of mortality at interim analysis (median six months,<br />
range six weeks <strong>to</strong> six months) did not reveal any significant difference<br />
between patients who were in receipt of CGA and those<br />
who were not (19 studies, 6786 participants, OR 0.91, 95% CI<br />
0.80 <strong>to</strong> 1.05, P = 0.20; Chi 2 = 32.3, P = 0.01, I 2 = 47%). No<br />
statistically significant subgroup interaction exists (Chi 2 = 0.92, P<br />
= 0.34, I 2 = 0%).<br />
Comparison 1.4: mortality (end of follow up)<br />
Similarly, analysis of mortality at the end of scheduled follow up<br />
(median 12 months, range six weeks <strong>to</strong> 12 months) did not differ<br />
significantly between intervention and control groups (23 studies,<br />
9963 participants, OR 0.99, 95% CI 0.90 <strong>to</strong> 1.09, P = 0.97; Chi 2<br />
= 24.15, P = 0.29, I 2 = 13%). No statistically significant subgroup<br />
interaction exists (Chi 2 = 0.05, P = 0.83, I 2 = 0%).<br />
Comparison 1.5: institutionalisation (up <strong>to</strong> six months)<br />
Comparison of institutionalisation alone at interim analysis (median<br />
six months, range six weeks <strong>to</strong> six months) demonstrated an<br />
overall decrease of patients in receipt of CGA in institutional care<br />
at up <strong>to</strong> six months (14 studies, 4925 participants, OR 0.72, 95%<br />
CI 0.61 <strong>to</strong> 0.85, P = 0.0001; Chi 2 = 14.43, P = 0.34, I 2 = 10%).<br />
This equates <strong>to</strong> a number needed <strong>to</strong> a NNT of 20 <strong>to</strong> avoid one<br />
unnecessary institutionalisation at up <strong>to</strong> six months compared <strong>to</strong><br />
general medical care. No statistically significant subgroup interaction<br />
exists (Chi 2 = 3.64, P = 0.06, I 2 = 72.5%).<br />
Comparison 1.6: institutionalisation (end of follow up)<br />
Analysis of data <strong>for</strong> institutionalisation at the end of scheduled<br />
follow up (median 12 months) revealed a significant reduction<br />
in institutionalisation <strong>for</strong> patients in receipt of CGA (19 studies,<br />
7137 participants, OR 0.78, 95% CI 0.69 <strong>to</strong> 0.88, P < 0.0001;<br />
Chi 2 = 18.36, P = 0.43, I 2 = 2%). This equates <strong>to</strong> a NNT of 25 <strong>to</strong><br />
avoid one unnecessary death or institutionalisation compared <strong>to</strong><br />
general medical care. However, subgroup interaction exists with<br />
slight overlap of confidence intervals (Chi 2 = 6.06, P = 0.01, I 2 =<br />
83.5%). There is a difference between the benefits of CGA wards<br />
(14 studies, 6252 participants, OR 0.73, 95% CI 0.64 <strong>to</strong> 0.84,<br />
P < 0.00001; Chi 2 = 10.64, P = 0.64, I 2 =0%) and CGA teams<br />
(five studies, 485 participants, OR 1.16, 95% CI 0.83 <strong>to</strong> 1.63, P =<br />
0.39; Chi 2 = 1.83, P = 0.77, I 2 = 0%). This suggests that the overall<br />
benefit results from trials of CGA wards. This difference would<br />
equate <strong>to</strong> a NNT of 20 from CGA wards <strong>to</strong> avoid one unnecessary<br />
institutionalisation compared <strong>to</strong> a general medical ward.<br />
9


