Comprehensive geriatric assessment for older adults admitted to ...
Comprehensive geriatric assessment for older adults admitted to ...
Comprehensive geriatric assessment for older adults admitted to ...

Create successful ePaper yourself
Turn your PDF publications into a flip-book with our unique Google optimized e-Paper software.
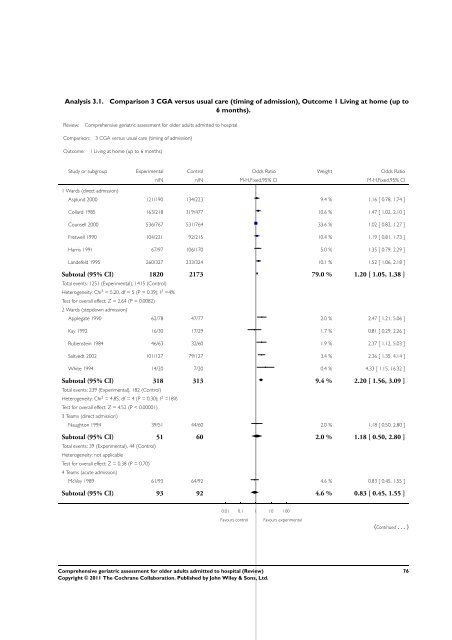
Analysis 3.1. Comparison 3 CGA versus usual care (timing of admission), Outcome 1 Living at home (up <strong>to</strong><br />
6 months).<br />
Review: <strong>Comprehensive</strong> <strong>geriatric</strong> <strong>assessment</strong> <strong>for</strong> <strong>older</strong> <strong>adults</strong> <strong>admitted</strong> <strong>to</strong> hospital<br />
Comparison: 3 CGA versus usual care (timing of admission)<br />
Outcome: 1 Living at home (up <strong>to</strong> 6 months)<br />
Study or subgroup Experimental Control Odds Ratio Weight Odds Ratio<br />
1 Wards (direct admission)<br />
n/N n/N M-H,Fixed,95% CI M-H,Fixed,95% CI<br />
Asplund 2000 121/190 134/223 9.4 % 1.16 [ 0.78, 1.74 ]<br />
Collard 1985 163/218 319/477 10.6 % 1.47 [ 1.02, 2.10 ]<br />
Counsell 2000 536/767 531/764 33.6 % 1.02 [ 0.82, 1.27 ]<br />
Fretwell 1990 104/221 92/215 10.4 % 1.19 [ 0.81, 1.73 ]<br />
Harris 1991 67/97 106/170 5.0 % 1.35 [ 0.79, 2.29 ]<br />
Landefeld 1995 260/327 233/324 10.1 % 1.52 [ 1.06, 2.18 ]<br />
Sub<strong>to</strong>tal (95% CI) 1820 2173 79.0 % 1.20 [ 1.05, 1.38 ]<br />
Total events: 1251 (Experimental), 1415 (Control)<br />
Heterogeneity: Chi 2 = 5.20, df = 5 (P = 0.39); I 2 =4%<br />
Test <strong>for</strong> overall effect: Z = 2.64 (P = 0.0082)<br />
2 Wards (stepdown admission)<br />
Applegate 1990 62/78 47/77 2.0 % 2.47 [ 1.21, 5.06 ]<br />
Kay 1992 16/30 17/29 1.7 % 0.81 [ 0.29, 2.26 ]<br />
Rubenstein 1984 46/63 32/60 1.9 % 2.37 [ 1.12, 5.03 ]<br />
Saltvedt 2002 101/127 79/127 3.4 % 2.36 [ 1.35, 4.14 ]<br />
White 1994 14/20 7/20 0.4 % 4.33 [ 1.15, 16.32 ]<br />
Sub<strong>to</strong>tal (95% CI) 318 313 9.4 % 2.20 [ 1.56, 3.09 ]<br />
Total events: 239 (Experimental), 182 (Control)<br />
Heterogeneity: Chi 2 = 4.85, df = 4 (P = 0.30); I 2 =18%<br />
Test <strong>for</strong> overall effect: Z = 4.52 (P < 0.00001)<br />
3 Teams (direct admission)<br />
Naugh<strong>to</strong>n 1994 39/51 44/60 2.0 % 1.18 [ 0.50, 2.80 ]<br />
Sub<strong>to</strong>tal (95% CI) 51 60 2.0 % 1.18 [ 0.50, 2.80 ]<br />
Total events: 39 (Experimental), 44 (Control)<br />
Heterogeneity: not applicable<br />
Test <strong>for</strong> overall effect: Z = 0.38 (P = 0.70)<br />
4 Teams (acute admission)<br />
McVey 1989 61/93 64/92 4.6 % 0.83 [ 0.45, 1.55 ]<br />
Sub<strong>to</strong>tal (95% CI) 93 92 4.6 % 0.83 [ 0.45, 1.55 ]<br />
0.01 0.1 1 10 100<br />
Favours control Favours experimental<br />
<strong>Comprehensive</strong> <strong>geriatric</strong> <strong>assessment</strong> <strong>for</strong> <strong>older</strong> <strong>adults</strong> <strong>admitted</strong> <strong>to</strong> hospital (Review)<br />
Copyright © 2011 The Cochrane Collaboration. Published by John Wiley & Sons, Ltd.<br />
(Continued ...)<br />
76