Comprehensive geriatric assessment for older adults admitted to ...
Comprehensive geriatric assessment for older adults admitted to ...
Comprehensive geriatric assessment for older adults admitted to ...

Create successful ePaper yourself
Turn your PDF publications into a flip-book with our unique Google optimized e-Paper software.
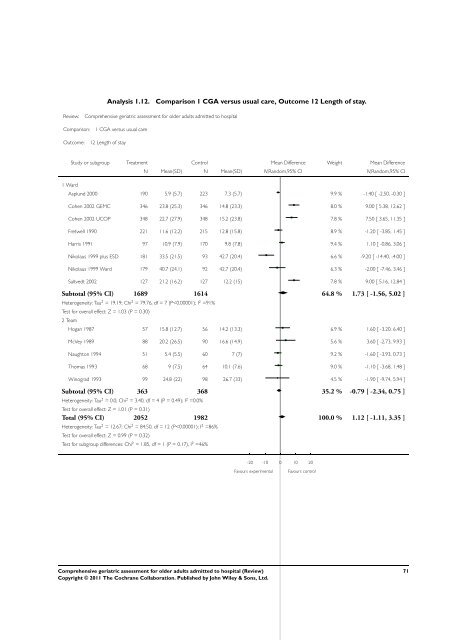
Analysis 1.12. Comparison 1 CGA versus usual care, Outcome 12 Length of stay.<br />
Review: <strong>Comprehensive</strong> <strong>geriatric</strong> <strong>assessment</strong> <strong>for</strong> <strong>older</strong> <strong>adults</strong> <strong>admitted</strong> <strong>to</strong> hospital<br />
Comparison: 1 CGA versus usual care<br />
Outcome: 12 Length of stay<br />
1 Ward<br />
Study or subgroup Treatment Control Mean Difference Weight Mean Difference<br />
N Mean(SD) N Mean(SD) IV,Random,95% CI IV,Random,95% CI<br />
Asplund 2000 190 5.9 (5.7) 223 7.3 (5.7) 9.9 % -1.40 [ -2.50, -0.30 ]<br />
Cohen 2002 GEMC 346 23.8 (25.3) 346 14.8 (23.3) 8.0 % 9.00 [ 5.38, 12.62 ]<br />
Cohen 2002 UCOP 348 22.7 (27.9) 348 15.2 (23.8) 7.8 % 7.50 [ 3.65, 11.35 ]<br />
Fretwell 1990 221 11.6 (12.2) 215 12.8 (15.8) 8.9 % -1.20 [ -3.85, 1.45 ]<br />
Harris 1991 97 10.9 (7.9) 170 9.8 (7.8) 9.4 % 1.10 [ -0.86, 3.06 ]<br />
Nikolaus 1999 plus ESD 181 33.5 (21.5) 93 42.7 (20.4) 6.6 % -9.20 [ -14.40, -4.00 ]<br />
Nikolaus 1999 Ward 179 40.7 (24.1) 92 42.7 (20.4) 6.3 % -2.00 [ -7.46, 3.46 ]<br />
Saltvedt 2002 127 21.2 (16.2) 127 12.2 (15) 7.8 % 9.00 [ 5.16, 12.84 ]<br />
Sub<strong>to</strong>tal (95% CI) 1689 1614 64.8 % 1.73 [ -1.56, 5.02 ]<br />
Heterogeneity: Tau 2 = 19.19; Chi 2 = 79.76, df = 7 (P