Comprehensive geriatric assessment for older adults admitted to ...
Comprehensive geriatric assessment for older adults admitted to ...
Comprehensive geriatric assessment for older adults admitted to ...

You also want an ePaper? Increase the reach of your titles
YUMPU automatically turns print PDFs into web optimized ePapers that Google loves.
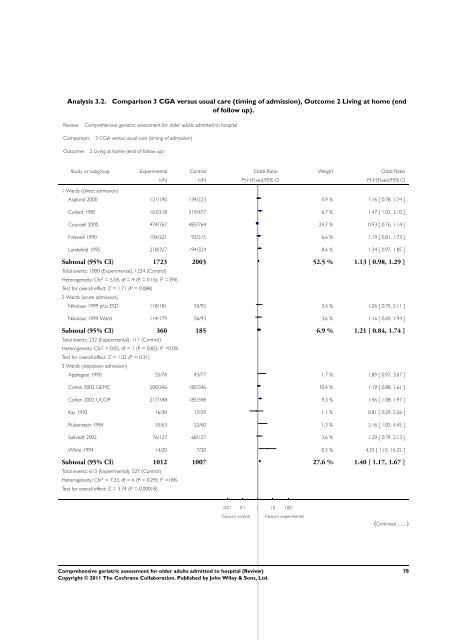
Analysis 3.2. Comparison 3 CGA versus usual care (timing of admission), Outcome 2 Living at home (end<br />
of follow up).<br />
Review: <strong>Comprehensive</strong> <strong>geriatric</strong> <strong>assessment</strong> <strong>for</strong> <strong>older</strong> <strong>adults</strong> <strong>admitted</strong> <strong>to</strong> hospital<br />
Comparison: 3 CGA versus usual care (timing of admission)<br />
Outcome: 2 Living at home (end of follow up)<br />
Study or subgroup Experimental Control Odds Ratio Weight Odds Ratio<br />
1 Wards (direct admission)<br />
n/N n/N M-H,Fixed,95% CI M-H,Fixed,95% CI<br />
Asplund 2000 121/190 134/223 5.9 % 1.16 [ 0.78, 1.74 ]<br />
Collard 1985 163/218 319/477 6.7 % 1.47 [ 1.02, 2.10 ]<br />
Counsell 2000 474/767 485/764 24.7 % 0.93 [ 0.76, 1.14 ]<br />
Fretwell 1990 104/221 92/215 6.6 % 1.19 [ 0.81, 1.73 ]<br />
Landefeld 1995 218/327 194/324 8.6 % 1.34 [ 0.97, 1.85 ]<br />
Sub<strong>to</strong>tal (95% CI) 1723 2003 52.5 % 1.13 [ 0.98, 1.29 ]<br />
Total events: 1080 (Experimental), 1224 (Control)<br />
Heterogeneity: Chi 2 = 6.58, df = 4 (P = 0.16); I 2 =39%<br />
Test <strong>for</strong> overall effect: Z = 1.71 (P = 0.088)<br />
2 Wards (acute admission)<br />
Nikolaus 1999 plus ESD 118/181 55/92 3.4 % 1.26 [ 0.75, 2.11 ]<br />
Nikolaus 1999 Ward 114/179 56/93 3.6 % 1.16 [ 0.69, 1.94 ]<br />
Sub<strong>to</strong>tal (95% CI) 360 185 6.9 % 1.21 [ 0.84, 1.74 ]<br />
Total events: 232 (Experimental), 111 (Control)<br />
Heterogeneity: Chi 2 = 0.05, df = 1 (P = 0.82); I 2 =0.0%<br />
Test <strong>for</strong> overall effect: Z = 1.02 (P = 0.31)<br />
3 Wards (stepdown admission)<br />
Applegate 1990 55/78 43/77 1.7 % 1.89 [ 0.97, 3.67 ]<br />
Cohen 2002 GEMC 200/346 185/346 10.4 % 1.19 [ 0.88, 1.61 ]<br />
Cohen 2002 UCOP 217/348 185/348 9.3 % 1.46 [ 1.08, 1.97 ]<br />
Kay 1992 16/30 17/29 1.1 % 0.81 [ 0.29, 2.26 ]<br />
Rubenstein 1984 35/63 22/60 1.3 % 2.16 [ 1.05, 4.45 ]<br />
Saltvedt 2002 76/127 68/127 3.6 % 1.29 [ 0.79, 2.13 ]<br />
White 1994 14/20 7/20 0.3 % 4.33 [ 1.15, 16.32 ]<br />
Sub<strong>to</strong>tal (95% CI) 1012 1007 27.6 % 1.40 [ 1.17, 1.67 ]<br />
Total events: 613 (Experimental), 527 (Control)<br />
Heterogeneity: Chi 2 = 7.33, df = 6 (P = 0.29); I 2 =18%<br />
Test <strong>for</strong> overall effect: Z = 3.74 (P = 0.00018)<br />
0.01 0.1 1 10 100<br />
Favours control Favours experimental<br />
<strong>Comprehensive</strong> <strong>geriatric</strong> <strong>assessment</strong> <strong>for</strong> <strong>older</strong> <strong>adults</strong> <strong>admitted</strong> <strong>to</strong> hospital (Review)<br />
Copyright © 2011 The Cochrane Collaboration. Published by John Wiley & Sons, Ltd.<br />
(Continued ...)<br />
78