Comprehensive geriatric assessment for older adults admitted to ...
Comprehensive geriatric assessment for older adults admitted to ...
Comprehensive geriatric assessment for older adults admitted to ...

Create successful ePaper yourself
Turn your PDF publications into a flip-book with our unique Google optimized e-Paper software.
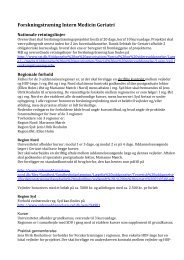
(... Continued)<br />
Study or subgroup Treatment Control Odds Ratio Odds Ratio<br />
n/N n/N M-H,Fixed,95% CI M-H,Fixed,95% CI<br />
Thomas 1993 7/68 13/64 0.45 [ 0.17, 1.21 ]<br />
Winograd 1993 41/99 35/98 1.27 [ 0.72, 2.26 ]<br />
Sub<strong>to</strong>tal (95% CI) 1855 1515 1.00 [ 0.86, 1.18 ]<br />
Total events: 467 (Treatment), 379 (Control)<br />
Heterogeneity: Chi 2 = 5.29, df = 6 (P = 0.51); I 2 =0.0%<br />
Test <strong>for</strong> overall effect: Z = 0.03 (P = 0.97)<br />
Total (95% CI) 5067 4896 0.99 [ 0.90, 1.09 ]<br />
Total events: 1146 (Treatment), 1073 (Control)<br />
Heterogeneity: Chi 2 = 24.15, df = 21 (P = 0.29); I 2 =13%<br />
Test <strong>for</strong> overall effect: Z = 0.23 (P = 0.82)<br />
Test <strong>for</strong> subgroup differences: Chi 2 = 0.05, df = 1 (P = 0.83), I 2 =0.0%<br />
0.01 0.1 1 10 100<br />
Favours experimental Favours control<br />
Analysis 1.5. Comparison 1 CGA versus usual care, Outcome 5 Institutionalisation (up <strong>to</strong> 6 months).<br />
Review: <strong>Comprehensive</strong> <strong>geriatric</strong> <strong>assessment</strong> <strong>for</strong> <strong>older</strong> <strong>adults</strong> <strong>admitted</strong> <strong>to</strong> hospital<br />
Comparison: 1 CGA versus usual care<br />
Outcome: 5 Institutionalisation (up <strong>to</strong> 6 months)<br />
Study or subgroup Treatment Control Odds Ratio Weight Odds Ratio<br />
1 Ward<br />
n/N n/N M-H,Fixed,95% CI M-H,Fixed,95% CI<br />
Applegate 1990 8/78 14/77 3.3 % 0.51 [ 0.20, 1.31 ]<br />
Asplund 2000 48/169 72/206 11.9 % 0.74 [ 0.48, 1.15 ]<br />
Collard 1985 47/218 119/477 15.1 % 0.83 [ 0.56, 1.21 ]<br />
Counsell 2000 58/767 61/764 14.5 % 0.94 [ 0.65, 1.37 ]<br />
Fretwell 1990 70/221 85/215 15.1 % 0.71 [ 0.48, 1.05 ]<br />
Kay 1992 12/30 12/29 1.9 % 0.94 [ 0.33, 2.67 ]<br />
Landefeld 1995 43/327 67/324 15.0 % 0.58 [ 0.38, 0.88 ]<br />
Rubenstein 1984 8/63 19/60 4.4 % 0.31 [ 0.13, 0.79 ]<br />
Saltvedt 2002 11/127 14/127 3.3 % 0.77 [ 0.33, 1.76 ]<br />
0.01 0.1 1 10 100<br />
Favours experimental Favours control<br />
<strong>Comprehensive</strong> <strong>geriatric</strong> <strong>assessment</strong> <strong>for</strong> <strong>older</strong> <strong>adults</strong> <strong>admitted</strong> <strong>to</strong> hospital (Review)<br />
Copyright © 2011 The Cochrane Collaboration. Published by John Wiley & Sons, Ltd.<br />
(Continued ...)<br />
63