Comprehensive geriatric assessment for older adults admitted to ...
Comprehensive geriatric assessment for older adults admitted to ...
Comprehensive geriatric assessment for older adults admitted to ...

You also want an ePaper? Increase the reach of your titles
YUMPU automatically turns print PDFs into web optimized ePapers that Google loves.
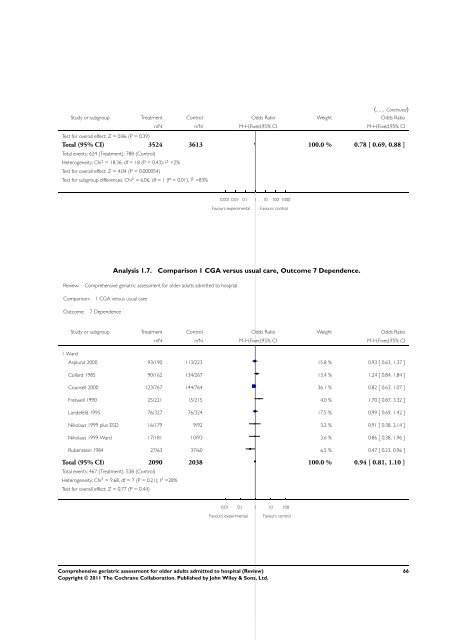
(... Continued)<br />
Study or subgroup Treatment Control Odds Ratio Weight Odds Ratio<br />
n/N n/N M-H,Fixed,95% CI M-H,Fixed,95% CI<br />
Test <strong>for</strong> overall effect: Z = 0.86 (P = 0.39)<br />
Total (95% CI) 3524 3613 100.0 % 0.78 [ 0.69, 0.88 ]<br />
Total events: 624 (Treatment), 788 (Control)<br />
Heterogeneity: Chi 2 = 18.36, df = 18 (P = 0.43); I 2 =2%<br />
Test <strong>for</strong> overall effect: Z = 4.04 (P = 0.000054)<br />
Test <strong>for</strong> subgroup differences: Chi 2 = 6.06, df = 1 (P = 0.01), I 2 =83%<br />
0.001 0.01 0.1 1 10 100 1000<br />
Favours experimental Favours control<br />
Analysis 1.7. Comparison 1 CGA versus usual care, Outcome 7 Dependence.<br />
Review: <strong>Comprehensive</strong> <strong>geriatric</strong> <strong>assessment</strong> <strong>for</strong> <strong>older</strong> <strong>adults</strong> <strong>admitted</strong> <strong>to</strong> hospital<br />
Comparison: 1 CGA versus usual care<br />
Outcome: 7 Dependence<br />
1 Ward<br />
Study or subgroup Treatment Control Odds Ratio Weight Odds Ratio<br />
n/N n/N M-H,Fixed,95% CI M-H,Fixed,95% CI<br />
Asplund 2000 93/190 113/223 15.8 % 0.93 [ 0.63, 1.37 ]<br />
Collard 1985 90/162 134/267 13.4 % 1.24 [ 0.84, 1.84 ]<br />
Counsell 2000 123/767 144/764 36.1 % 0.82 [ 0.63, 1.07 ]<br />
Fretwell 1990 25/221 15/215 4.0 % 1.70 [ 0.87, 3.32 ]<br />
Landefeld 1995 76/327 76/324 17.5 % 0.99 [ 0.69, 1.42 ]<br />
Nikolaus 1999 plus ESD 16/179 9/92 3.2 % 0.91 [ 0.38, 2.14 ]<br />
Nikolaus 1999 Ward 17/181 10/93 3.6 % 0.86 [ 0.38, 1.96 ]<br />
Rubenstein 1984 27/63 37/60 6.5 % 0.47 [ 0.23, 0.96 ]<br />
Total (95% CI) 2090 2038 100.0 % 0.94 [ 0.81, 1.10 ]<br />
Total events: 467 (Treatment), 538 (Control)<br />
Heterogeneity: Chi 2 = 9.68, df = 7 (P = 0.21); I 2 =28%<br />
Test <strong>for</strong> overall effect: Z = 0.77 (P = 0.44)<br />
0.01 0.1 1 10 100<br />
Favours experimental Favours control<br />
<strong>Comprehensive</strong> <strong>geriatric</strong> <strong>assessment</strong> <strong>for</strong> <strong>older</strong> <strong>adults</strong> <strong>admitted</strong> <strong>to</strong> hospital (Review)<br />
Copyright © 2011 The Cochrane Collaboration. Published by John Wiley & Sons, Ltd.<br />
66