Comprehensive geriatric assessment for older adults admitted to ...
Comprehensive geriatric assessment for older adults admitted to ...
Comprehensive geriatric assessment for older adults admitted to ...

Create successful ePaper yourself
Turn your PDF publications into a flip-book with our unique Google optimized e-Paper software.
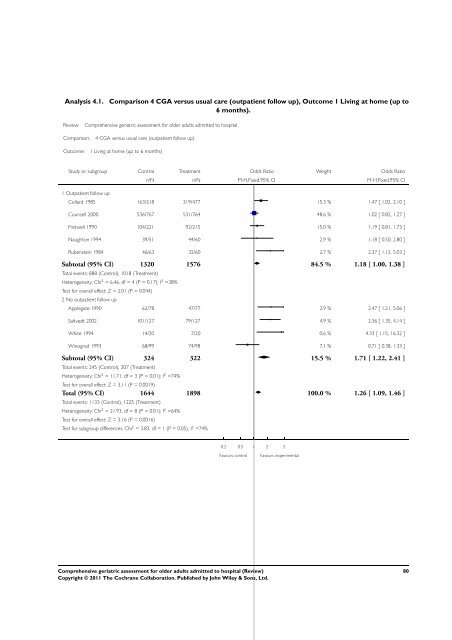
Analysis 4.1. Comparison 4 CGA versus usual care (outpatient follow up), Outcome 1 Living at home (up <strong>to</strong><br />
6 months).<br />
Review: <strong>Comprehensive</strong> <strong>geriatric</strong> <strong>assessment</strong> <strong>for</strong> <strong>older</strong> <strong>adults</strong> <strong>admitted</strong> <strong>to</strong> hospital<br />
Comparison: 4 CGA versus usual care (outpatient follow up)<br />
Outcome: 1 Living at home (up <strong>to</strong> 6 months)<br />
Study or subgroup Control Treatment Odds Ratio Weight Odds Ratio<br />
1 Outpatient follow up<br />
n/N n/N M-H,Fixed,95% CI M-H,Fixed,95% CI<br />
Collard 1985 163/218 319/477 15.3 % 1.47 [ 1.02, 2.10 ]<br />
Counsell 2000 536/767 531/764 48.6 % 1.02 [ 0.82, 1.27 ]<br />
Fretwell 1990 104/221 92/215 15.0 % 1.19 [ 0.81, 1.73 ]<br />
Naugh<strong>to</strong>n 1994 39/51 44/60 2.9 % 1.18 [ 0.50, 2.80 ]<br />
Rubenstein 1984 46/63 32/60 2.7 % 2.37 [ 1.12, 5.03 ]<br />
Sub<strong>to</strong>tal (95% CI) 1320 1576 84.5 % 1.18 [ 1.00, 1.38 ]<br />
Total events: 888 (Control), 1018 (Treatment)<br />
Heterogeneity: Chi 2 = 6.46, df = 4 (P = 0.17); I 2 =38%<br />
Test <strong>for</strong> overall effect: Z = 2.01 (P = 0.044)<br />
2 No outpatient follow up<br />
Applegate 1990 62/78 47/77 2.9 % 2.47 [ 1.21, 5.06 ]<br />
Saltvedt 2002 101/127 79/127 4.9 % 2.36 [ 1.35, 4.14 ]<br />
White 1994 14/20 7/20 0.6 % 4.33 [ 1.15, 16.32 ]<br />
Winograd 1993 68/99 74/98 7.1 % 0.71 [ 0.38, 1.33 ]<br />
Sub<strong>to</strong>tal (95% CI) 324 322 15.5 % 1.71 [ 1.22, 2.41 ]<br />
Total events: 245 (Control), 207 (Treatment)<br />
Heterogeneity: Chi 2 = 11.71, df = 3 (P = 0.01); I 2 =74%<br />
Test <strong>for</strong> overall effect: Z = 3.11 (P = 0.0019)<br />
Total (95% CI) 1644 1898 100.0 % 1.26 [ 1.09, 1.46 ]<br />
Total events: 1133 (Control), 1225 (Treatment)<br />
Heterogeneity: Chi 2 = 21.93, df = 8 (P = 0.01); I 2 =64%<br />
Test <strong>for</strong> overall effect: Z = 3.16 (P = 0.0016)<br />
Test <strong>for</strong> subgroup differences: Chi 2 = 3.83, df = 1 (P = 0.05), I 2 =74%<br />
0.2 0.5 1 2 5<br />
Favours control Favours experimental<br />
<strong>Comprehensive</strong> <strong>geriatric</strong> <strong>assessment</strong> <strong>for</strong> <strong>older</strong> <strong>adults</strong> <strong>admitted</strong> <strong>to</strong> hospital (Review)<br />
Copyright © 2011 The Cochrane Collaboration. Published by John Wiley & Sons, Ltd.<br />
80