Comprehensive geriatric assessment for older adults admitted to ...
Comprehensive geriatric assessment for older adults admitted to ...
Comprehensive geriatric assessment for older adults admitted to ...

You also want an ePaper? Increase the reach of your titles
YUMPU automatically turns print PDFs into web optimized ePapers that Google loves.
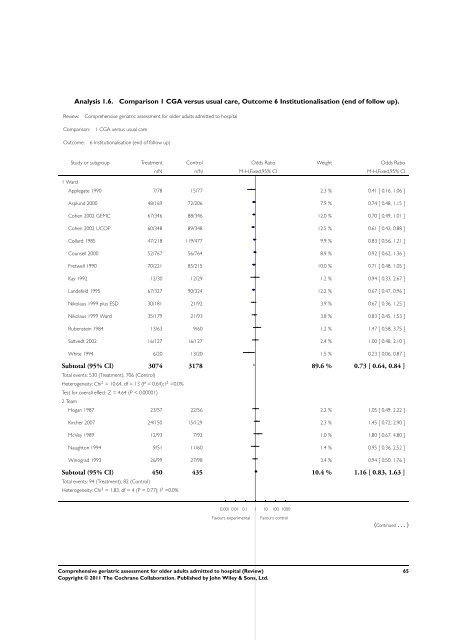
Analysis 1.6. Comparison 1 CGA versus usual care, Outcome 6 Institutionalisation (end of follow up).<br />
Review: <strong>Comprehensive</strong> <strong>geriatric</strong> <strong>assessment</strong> <strong>for</strong> <strong>older</strong> <strong>adults</strong> <strong>admitted</strong> <strong>to</strong> hospital<br />
Comparison: 1 CGA versus usual care<br />
Outcome: 6 Institutionalisation (end of follow up)<br />
1 Ward<br />
Study or subgroup Treatment Control Odds Ratio Weight Odds Ratio<br />
n/N n/N M-H,Fixed,95% CI M-H,Fixed,95% CI<br />
Applegate 1990 7/78 15/77 2.3 % 0.41 [ 0.16, 1.06 ]<br />
Asplund 2000 48/169 72/206 7.9 % 0.74 [ 0.48, 1.15 ]<br />
Cohen 2002 GEMC 67/346 88/346 12.0 % 0.70 [ 0.49, 1.01 ]<br />
Cohen 2002 UCOP 60/348 89/348 12.5 % 0.61 [ 0.42, 0.88 ]<br />
Collard 1985 47/218 119/477 9.9 % 0.83 [ 0.56, 1.21 ]<br />
Counsell 2000 52/767 56/764 8.9 % 0.92 [ 0.62, 1.36 ]<br />
Fretwell 1990 70/221 85/215 10.0 % 0.71 [ 0.48, 1.05 ]<br />
Kay 1992 12/30 12/29 1.2 % 0.94 [ 0.33, 2.67 ]<br />
Landefeld 1995 67/327 90/324 12.2 % 0.67 [ 0.47, 0.96 ]<br />
Nikolaus 1999 plus ESD 30/181 21/92 3.9 % 0.67 [ 0.36, 1.25 ]<br />
Nikolaus 1999 Ward 35/179 21/93 3.8 % 0.83 [ 0.45, 1.53 ]<br />
Rubenstein 1984 13/63 9/60 1.2 % 1.47 [ 0.58, 3.75 ]<br />
Saltvedt 2002 16/127 16/127 2.4 % 1.00 [ 0.48, 2.10 ]<br />
White 1994 6/20 13/20 1.5 % 0.23 [ 0.06, 0.87 ]<br />
Sub<strong>to</strong>tal (95% CI) 3074 3178 89.6 % 0.73 [ 0.64, 0.84 ]<br />
Total events: 530 (Treatment), 706 (Control)<br />
Heterogeneity: Chi 2 = 10.64, df = 13 (P = 0.64); I 2 =0.0%<br />
Test <strong>for</strong> overall effect: Z = 4.64 (P < 0.00001)<br />
2 Team<br />
Hogan 1987 23/57 22/56 2.2 % 1.05 [ 0.49, 2.22 ]<br />
Kircher 2007 24/150 15/129 2.3 % 1.45 [ 0.72, 2.90 ]<br />
McVey 1989 12/93 7/92 1.0 % 1.80 [ 0.67, 4.80 ]<br />
Naugh<strong>to</strong>n 1994 9/51 11/60 1.4 % 0.95 [ 0.36, 2.52 ]<br />
Winograd 1993 26/99 27/98 3.4 % 0.94 [ 0.50, 1.76 ]<br />
Sub<strong>to</strong>tal (95% CI) 450 435 10.4 % 1.16 [ 0.83, 1.63 ]<br />
Total events: 94 (Treatment), 82 (Control)<br />
Heterogeneity: Chi 2 = 1.83, df = 4 (P = 0.77); I 2 =0.0%<br />
0.001 0.01 0.1 1 10 100 1000<br />
Favours experimental Favours control<br />
<strong>Comprehensive</strong> <strong>geriatric</strong> <strong>assessment</strong> <strong>for</strong> <strong>older</strong> <strong>adults</strong> <strong>admitted</strong> <strong>to</strong> hospital (Review)<br />
Copyright © 2011 The Cochrane Collaboration. Published by John Wiley & Sons, Ltd.<br />
(Continued ...)<br />
65