

Image Acquisitionand Proces

You also want an ePaper? Increase the reach of your titles
YUMPU automatically turns print PDFs into web optimized ePapers that Google loves.
100 <strong>Image</strong> Acquisition <strong>Proces</strong>sing with LabVIEW<br />
The procedure in the course of an experiment begins with the biological object<br />
of interest (a single cell in a vital brain section) is displayed as a video image on<br />
the PC monitor.<br />
ROIs of any shape can be located at speciÞc positions in the image as desired.<br />
The mean brightness value of these ROIs can be displayed simultaneously beside<br />
the live image as brightness-versus-time courses on the monitor. If required,<br />
pressing a key stores image sequences, theoretically of any desired length, without<br />
loss and in real time. The only limit to the recording duration is the storage capacity<br />
of the hard disk. The possibility for direct-to-disk storage is a major advance,<br />
since this circumvents the limitations inherent in the transient and nonpermanent<br />
storage in the expensive RAM and thus allows direct and permanent storage of<br />
digital Þlms using the economic and theoretically unlimited capacity of the hard<br />
disk. In addition, it is possible to communicate with the various peripheral experimental<br />
instruments (laser shutter, microscope z-drive, etc.) and trigger connections<br />
allow data exchange with a so-called “patch-clamp” ampliÞer, so that the start of<br />
an electrophysiological experiment can initiate the recording of an image sequence<br />
and vice versa.<br />
5.2.2.1 Analysis of Video Sequences<br />
The primary aim of the FastRecord module is the comfortable and comprehensive<br />
analysis of image sequences of various formats (AVI, Bio-Rad-PIC, BIN) obtained<br />
using FastRecord or other recording systems. The main focus thereby is the<br />
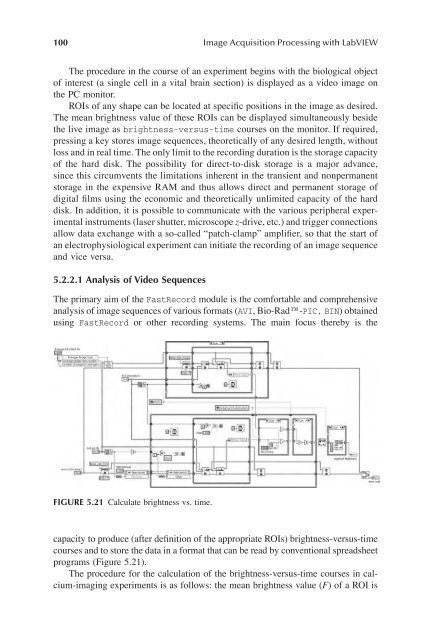
FIGURE 5.21 Calculate brightness vs. time.<br />
capacity to produce (after deÞnition of the appropriate ROIs) brightness-versus-time<br />
courses and to store the data in a format that can be read by conventional spreadsheet<br />
programs (Figure 5.21).<br />
The procedure for the calculation of the brightness-versus-time courses in calcium-imaging<br />
experiments is as follows: the mean brightness value (F) of a ROI is