- Page 3:
IMAGE PROCESSING SERIES Series Edit
- Page 6:
Foreword The introduction of LabVIE
- Page 9 and 10:
FIGURE 1 Vision 6.1 FIGURE 2 Compan
- Page 12 and 13:
Acknowledgments My gratitude goes o
- Page 14:
Dedication To Don “old fella” P
- Page 18 and 19:
Contents Chapter 1 Image Types and
- Page 20 and 21:
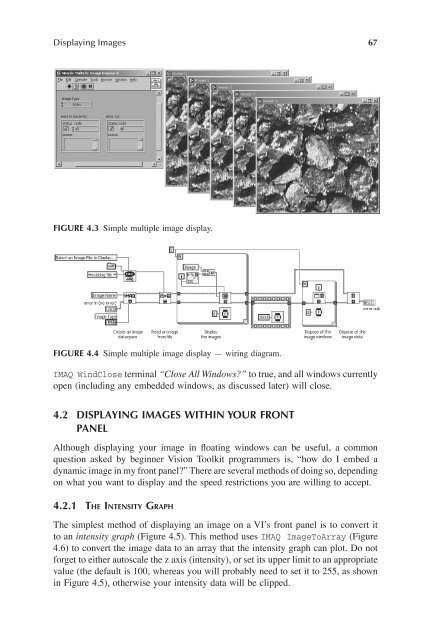
Chapter 4 Displaying Images........
- Page 22 and 23:
Chapter 7 Image Analysis...........
- Page 24 and 25:
1 Image Types and File Management F
- Page 26 and 27:
Image Types and File Management 3 F
- Page 28 and 29:
Image Types and File Management 5 A
- Page 30 and 31:
Image Types and File Management 7 C
- Page 32 and 33:
Image Types and File Management 9 p
- Page 34 and 35:
Image Types and File Management 11
- Page 36 and 37:
Image Types and File Management 13
- Page 38 and 39:
2 Setting Up You should never under
- Page 40 and 41: Setting Up 17 FIGURE 2.3 (a) Interl
- Page 42 and 43: Setting Up 19 Linear Aray Light Sou
- Page 44 and 45: Setting Up 21 FIGURE 2.7 National I
- Page 46 and 47: Setting Up 23 2.1.3.2 Control and I
- Page 48 and 49: Setting Up 25 FIGURE 2.11 X-Ray ima
- Page 50 and 51: Setting Up 27 Apple Computer techno
- Page 52 and 53: Setting Up 29 FIGURE 2.17 An inexpe
- Page 54 and 55: Setting Up 31 Although this would b
- Page 56 and 57: Setting Up 33 134 -115 \ Contrast =
- Page 58 and 59: Setting Up 35 resolution printer wi
- Page 60 and 61: Setting Up 37 C A B C Traditional T
- Page 62 and 63: Setting Up 39 Camera Light Source O
- Page 64 and 65: Setting Up 41 Camera Light Source (
- Page 66 and 67: Setting Up 43 FIGURE 2.37 (a) An ob
- Page 68: Setting Up 45 FIGURE 2.41 (a) PCB p
- Page 71 and 72: 48 Image Acquisition Processing wit
- Page 73 and 74: 50 Image Acquisition Processing wit
- Page 75 and 76: 52 Image Acquisition Processing wit
- Page 77 and 78: 54 Image Acquisition Processing wit
- Page 79 and 80: 56 Image Acquisition Processing wit
- Page 81 and 82: 58 Image Acquisition Processing wit
- Page 83 and 84: 60 Image Acquisition Processing wit
- Page 85 and 86: 62 Image Acquisition Processing wit
- Page 87 and 88: 64 Image Acquisition Processing wit
- Page 89: 66 Image Acquisition Processing wit
- Page 93 and 94: 70 Image Acquisition Processing wit
- Page 95 and 96: 72 Image Acquisition Processing wit
- Page 97 and 98: 74 Image Acquisition Processing wit
- Page 99 and 100: 76 Image Acquisition Processing wit
- Page 101 and 102: 78 Image Acquisition Processing wit
- Page 103 and 104: 80 Image Acquisition Processing wit
- Page 105 and 106: 82 Image Acquisition Processing wit
- Page 107 and 108: 84 Image Acquisition Processing wit
- Page 109 and 110: 86 Image Acquisition Processing wit
- Page 111 and 112: 88 Image Acquisition Processing wit
- Page 113 and 114: 90 Image Acquisition Processing wit
- Page 115 and 116: 92 Image Acquisition Processing wit
- Page 117 and 118: 94 Image Acquisition Processing wit
- Page 119 and 120: 96 Image Acquisition Processing wit
- Page 121 and 122: 98 Image Acquisition Processing wit
- Page 123 and 124: 100 Image Acquisition Processing wi
- Page 125 and 126: 102 Image Acquisition Processing wi
- Page 127 and 128: 104 Image Acquisition Processing wi
- Page 129 and 130: 106 Image Acquisition Processing wi
- Page 131 and 132: 108 Image Acquisition Processing wi
- Page 133 and 134: 110 Image Acquisition Processing wi
- Page 135 and 136: 112 Image Acquisition Processing wi
- Page 137 and 138: 114 Image Acquisition Processing wi
- Page 139 and 140: 116 Image Acquisition Processing wi
- Page 141 and 142:
118 Image Acquisition Processing wi
- Page 143 and 144:
120 Image Acquisition Processing wi
- Page 145 and 146:
122 Image Acquisition Processing wi
- Page 147 and 148:
124 Image Acquisition Processing wi
- Page 149 and 150:
126 Image Acquisition Processing wi
- Page 151 and 152:
128 Image Acquisition Processing wi
- Page 153 and 154:
130 Image Acquisition Processing wi
- Page 155 and 156:
132 Image Acquisition Processing wi
- Page 157 and 158:
134 Image Acquisition Processing wi
- Page 159 and 160:
136 Image Acquisition Processing wi
- Page 161 and 162:
138 Image Acquisition Processing wi
- Page 164 and 165:
6 Morphology When applied to vision
- Page 166 and 167:
Morphology 143 I Closed { } = Erode
- Page 168 and 169:
Morphology 145 FIGURE 6.3 Simple mo
- Page 170 and 171:
Morphology 147 FIGURE 6.5 Custom st
- Page 172 and 173:
Morphology 149 FIGURE 6.8 Particle
- Page 174 and 175:
Morphology 151 FIGURE 6.12 Fill hol
- Page 176 and 177:
Morphology 153 FIGURE 6.17 Danielss
- Page 178 and 179:
Morphology 155 Detected circles wit
- Page 180 and 181:
Morphology 157 6.5 CASE STUDY: FIND
- Page 182 and 183:
Morphology 159 6.6 USER SOLUTION: D
- Page 184 and 185:
Morphology 161 ULTRASOUND MACHINE (
- Page 186:
Morphology 163 FIGURE 6.31 The Edit
- Page 189 and 190:
166 Image Acquisition Processing wi
- Page 191 and 192:
168 Image Acquisition Processing wi
- Page 193 and 194:
170 Image Acquisition Processing wi
- Page 195 and 196:
172 Image Acquisition Processing wi
- Page 197 and 198:
174 Image Acquisition Processing wi
- Page 199 and 200:
176 Image Acquisition Processing wi
- Page 201 and 202:
178 Image Acquisition Processing wi
- Page 203 and 204:
180 Image Acquisition Processing wi
- Page 205 and 206:
182 Image Acquisition Processing wi
- Page 207 and 208:
184 Image Acquisition Processing wi
- Page 209 and 210:
186 Image Acquisition Processing wi
- Page 211 and 212:
188 Image Acquisition Processing wi
- Page 213 and 214:
190 Image Acquisition Processing wi
- Page 215 and 216:
192 Image Acquisition Processing wi
- Page 217 and 218:
194 Image Acquisition Processing wi
- Page 219 and 220:
196 Image Acquisition Processing wi
- Page 221 and 222:
198 Image Acquisition Processing wi
- Page 223 and 224:
200 Image Acquisition Processing wi
- Page 225 and 226:
202 Image Acquisition Processing wi
- Page 227 and 228:
204 Image Acquisition Processing wi
- Page 229 and 230:
206 Image Acquisition Processing wi
- Page 231 and 232:
208 Image Acquisition Processing wi
- Page 233 and 234:
210 Image Acquisition Processing wi
- Page 235 and 236:
212 Image Acquisition Processing wi
- Page 237 and 238:
214 Image Acquisition Processing wi
- Page 240 and 241:
8 Machine Vision A generally accept
- Page 242 and 243:
Machine Vision 219 TABLE 8.1 “IMA
- Page 244 and 245:
Machine Vision 221 TABLE 8.3 Input
- Page 246 and 247:
Machine Vision 223 packages, includ
- Page 248 and 249:
Machine Vision 225 good sense to ad
- Page 250 and 251:
Machine Vision 227 TABLE 8.4 “IMA
- Page 252 and 253:
Glossary 1-Bit Image An image compr
- Page 254 and 255:
Glossary 231 binary display device
- Page 256 and 257:
Glossary 233 spatial Þlters, each
- Page 258:
Glossary 235 Resolution There are t
- Page 261 and 262:
238 Image Acquisition Processing wi
- Page 263 and 264:
240 Image Acquisition Processing wi
- Page 265 and 266:
242 Image Acquisition Processing wi
- Page 267:
244 Image Acquisition Processing wi