

Image Acquisitionand Proces

Create successful ePaper yourself
Turn your PDF publications into a flip-book with our unique Google optimized e-Paper software.
200 <strong>Image</strong> Acquisition <strong>Proces</strong>sing with LabVIEW<br />
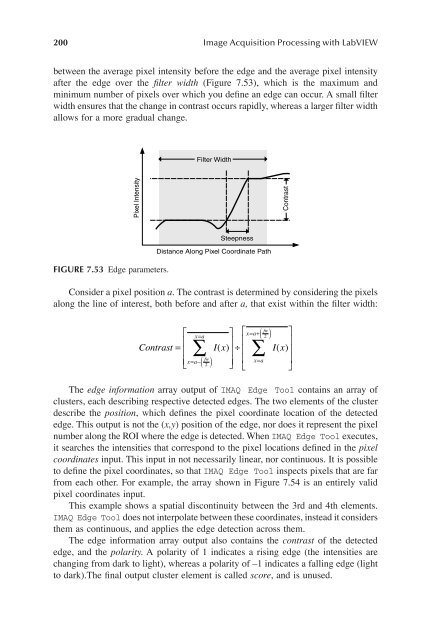
between the average pixel intensity before the edge and the average pixel intensity<br />
after the edge over the Þlter width (Figure 7.53), which is the maximum and<br />
minimum number of pixels over which you deÞne an edge can occur. A small Þlter<br />
width ensures that the change in contrast occurs rapidly, whereas a larger Þlter width<br />
allows for a more gradual change.<br />
Filter Width<br />
Pixel Intensity<br />
Contrast<br />
FIGURE 7.53 Edge parameters.<br />
Steepness<br />
Distance Along Pixel Coordinate Path<br />
Consider a pixel position a. The contrast is determined by considering the pixels<br />
along the line of interest, both before and after a, that exist within the Þlter width:<br />
fw<br />
È x a ù Èx a ù<br />
=<br />
2<br />
Í ú Í ú<br />
Contrast =<br />
Í Â I( x) ú<br />
∏ Í Â I( x)<br />
ú<br />
fw<br />
x a<br />
x a<br />
Î<br />
Í = -( ) û<br />
ú Í = ú<br />
2<br />
Î û<br />
= +( )<br />
The edge information array output of IMAQ Edge Tool contains an array of<br />
clusters, each describing respective detected edges. The two elements of the cluster<br />
describe the position, which deÞnes the pixel coordinate location of the detected<br />
edge. This output is not the (x,y) position of the edge, nor does it represent the pixel<br />
number along the ROI where the edge is detected. When IMAQ Edge Tool executes,<br />
it searches the intensities that correspond to the pixel locations deÞned in the pixel<br />
coordinates input. This input in not necessarily linear, nor continuous. It is possible<br />
to deÞne the pixel coordinates, so that IMAQ Edge Tool inspects pixels that are far<br />
from each other. For example, the array shown in Figure 7.54 is an entirely valid<br />
pixel coordinates input.<br />
This example shows a spatial discontinuity between the 3rd and 4th elements.<br />
IMAQ Edge Tool does not interpolate between these coordinates, instead it considers<br />
them as continuous, and applies the edge detection across them.<br />
The edge information array output also contains the contrast of the detected<br />
edge, and the polarity. A polarity of 1 indicates a rising edge (the intensities are<br />
changing from dark to light), whereas a polarity of –1 indicates a falling edge (light<br />
to dark).The Þnal output cluster element is called score, and is unused.