Legal empowerment for local resource control
Legal empowerment for local resource control
Legal empowerment for local resource control

Create successful ePaper yourself
Turn your PDF publications into a flip-book with our unique Google optimized e-Paper software.
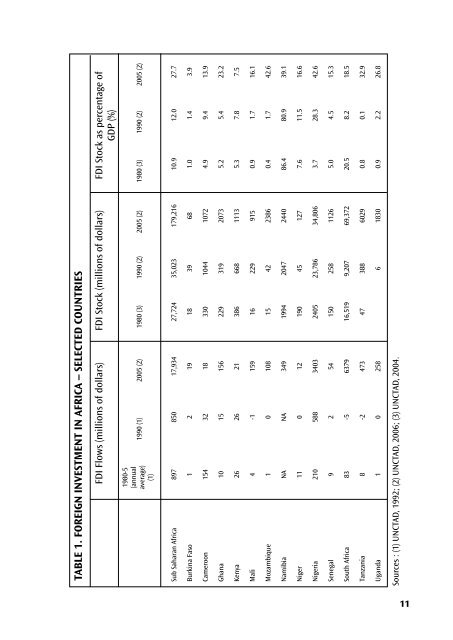
TABLE 1. FOREIGN INVESTMENT IN AFRICA – SELECTED COUNTRIES<br />
FDI Stock (millions of dollars) FDI Stock as percentage of<br />
GDP (%)<br />
FDI Flows (millions of dollars)<br />
1990 (1) 2005 (2) 1980 (3) 1990 (2) 2005 (2) 1980 (3) 1990 (2) 2005 (2)<br />
1980-5<br />
(annual<br />
average)<br />
(1)<br />
Sub Saharan Africa 897 850 17,934 27,724 35,023 179,216 10.9 12.0 27.7<br />
Burkina Faso 1 2 19 18 39 68 1.0 1.4 3.9<br />
Cameroon 154 32 18 330 1044 1072 4.9 9.4 13.9<br />
Ghana 10 15 156 229 319 2073 5.2 5.4 23.2<br />
Kenya 26 26 21 386 668 1113 5.3 7.8 7.5<br />
Mali 4 -1 159 16 229 915 0.9 1.7 16.1<br />
Mozambique 1 0 108 15 42 2386 0.4 1.7 42.6<br />
Namibia NA NA 349 1994 2047 2440 86.4 80.9 39.1<br />
Niger 11 0 12 190 45 127 7.6 11.5 16.6<br />
Nigeria 210 588 3403 2405 23,786 34,806 3.7 28.3 42.6<br />
Senegal 9 2 54 150 258 1126 5.0 4.5 15.3<br />
South Africa 83 -5 6379 16,519 9,207 69,372 20.5 8.2 18.5<br />
Tanzania 8 -2 473 47 388 6029 0.8 0.1 32.9<br />
Uganda 1 0 258 6 1830 0.9 2.2 26.8<br />
Sources : (1) UNCTAD, 1992; (2) UNCTAD, 2006; (3) UNCTAD, 2004.<br />
11