Emerging Business Models in the Pharmaceutical Industries ...
Emerging Business Models in the Pharmaceutical Industries ...
Emerging Business Models in the Pharmaceutical Industries ...

Create successful ePaper yourself
Turn your PDF publications into a flip-book with our unique Google optimized e-Paper software.
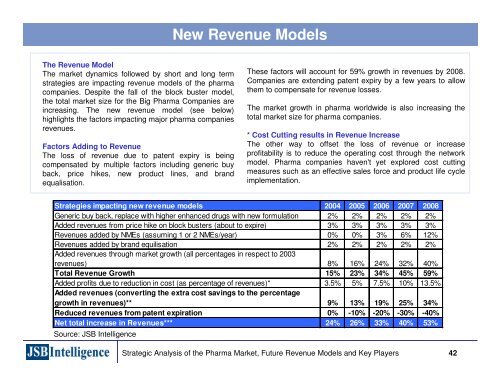
The Revenue Model<br />
The market dynamics followed by short and long term<br />
strategies are impact<strong>in</strong>g revenue models of <strong>the</strong> pharma<br />
companies. Despite <strong>the</strong> fall of <strong>the</strong> block buster model,<br />
<strong>the</strong> total market size for <strong>the</strong> Big Pharma Companies are<br />
<strong>in</strong>creas<strong>in</strong>g. The new revenue model (see below)<br />
highlights <strong>the</strong> factors impact<strong>in</strong>g major pharma companies<br />
revenues.<br />
Factors Add<strong>in</strong>g to Revenue<br />
The loss of revenue due to patent expiry is be<strong>in</strong>g<br />
compensated by multiple factors <strong>in</strong>clud<strong>in</strong>g generic buy<br />
back, price hikes, new product l<strong>in</strong>es, and brand<br />
equalisation.<br />
New Revenue <strong>Models</strong><br />
Strategies impact<strong>in</strong>g new revenue models 2004 2005 2006 2007 2008<br />
Generic buy back, replace with higher enhanced drugs with new formulation 2% 2% 2% 2% 2%<br />
Added revenues from price hike on block busters (about to expire) 3% 3% 3% 3% 3%<br />
Revenues added by NMEs (assum<strong>in</strong>g 1 or 2 NMEs/year) 0% 0% 3% 6% 12%<br />
Revenues added by brand equilisation 2% 2% 2% 2% 2%<br />
Added revenues through market growth (all percentages <strong>in</strong> respect to 2003<br />
revenues) 8% 16% 24% 32% 40%<br />
Total Revenue Growth 15% 23% 34% 45% 59%<br />
Added profits due to reduction <strong>in</strong> cost (as percentage of revenues)* 3.5% 5% 7.5% 10% 13.5%<br />
Added revenues (convert<strong>in</strong>g <strong>the</strong> extra cost sav<strong>in</strong>gs to <strong>the</strong> percentage<br />
growth <strong>in</strong> revenues)** 9% 13% 19% 25% 34%<br />
Reduced revenues from patent expiration 0% -10% -20% -30% -40%<br />
Net total <strong>in</strong>crease <strong>in</strong> Revenues*** 24% 26% 33% 40% 53%<br />
Source: JSB Intelligence<br />
These factors will account for 59% growth <strong>in</strong> revenues by 2008.<br />
Companies are extend<strong>in</strong>g patent expiry by a few years to allow<br />
<strong>the</strong>m to compensate for revenue losses.<br />
The market growth <strong>in</strong> pharma worldwide is also <strong>in</strong>creas<strong>in</strong>g <strong>the</strong><br />
total market size for pharma companies.<br />
* Cost Cutt<strong>in</strong>g results <strong>in</strong> Revenue Increase<br />
The o<strong>the</strong>r way to offset <strong>the</strong> loss of revenue or <strong>in</strong>crease<br />
profitability is to reduce <strong>the</strong> operat<strong>in</strong>g cost through <strong>the</strong> network<br />
model. Pharma companies haven't yet explored cost cutt<strong>in</strong>g<br />
measures such as an effective sales force and product life cycle<br />
implementation.<br />
Strategic Analysis of <strong>the</strong> Pharma Market, Future Revenue <strong>Models</strong> and Key Players 42