Final report for WP4.3: Enhancement of design methods ... - Upwind
Final report for WP4.3: Enhancement of design methods ... - Upwind
Final report for WP4.3: Enhancement of design methods ... - Upwind

You also want an ePaper? Increase the reach of your titles
YUMPU automatically turns print PDFs into web optimized ePapers that Google loves.
The following results are found: Firstly, the frequencies associated with the first global bending modes <strong>of</strong><br />
the support structure are shifted by approximately 5% towards lower frequencies as mentioned be<strong>for</strong>e.<br />
Those frequencies are among the most important <strong>design</strong> parameters <strong>for</strong> OWT support structures as it is<br />
common practice to <strong>design</strong> structures with a first natural frequency between the 1P and the 3P range<br />
(s<strong>of</strong>t-stiff <strong>design</strong>) <strong>of</strong> the turbine. The allowable frequency gap is relatively small, especially as a distance <strong>of</strong><br />
about 10% between natural frequency and excitation range has usually to be provided <strong>for</strong> safety reasons<br />
(not shown in Figure 4.4). For the NREL turbine, the more detailed modeling would lead to higher theoretical<br />
safety margins, as the frequencies are shifted towards the dead center between the 1P and the 3P<br />
range.<br />
Secondly, the third full system natural frequency is shifted into the upper 3P frequency range due to the<br />
more realistic support structure modeling. The difference between the third natural frequency calculated<br />
with the beam model and the super-element model is about 7%. The excitations mainly due to disturbed<br />
wind flow around the tower in the 3P range are considered to bring more energy into the system than its<br />
harmonics and even more than the excitations in the 1P range (e.g. see [65]). Furthermore, the natural<br />
frequency is found near the upper bound <strong>of</strong> the 3P range which is associated with rated rotor speed. It is<br />
obvious that the turbine operates much more <strong>of</strong>ten at rated rotor speed than at lower speeds, as this is the<br />
operational speed at all wind speeds above rated wind speed. The maximum rotor thrust occurring at<br />
rated wind speed makes a strong dynamic excitation at this speed even more probable.<br />
Thirdly, the ninth natural frequency is shifted to the upper 6P range. This is not too critical, other natural<br />
frequencies are found in the 6P range as well.<br />
All in all, the support structure modeling with super-elements leads to changes in comparison to the basic<br />
beam model concerning the full system eigenstates that are not negligible.<br />
Load case definition <strong>for</strong> load comparison<br />
The next step is the study <strong>of</strong> the impact <strong>of</strong> super-element modeling <strong>of</strong> joints on the results <strong>of</strong> aero-elastic<br />
time domain simulations <strong>of</strong> realistic load cases as described in the respective standards. A heavily reduced<br />
set <strong>of</strong> sub-cases is to be used to get a reasonable balance between simulation ef<strong>for</strong>t and proximity<br />
to loads simulation as done in OWT certification.<br />
The IEC 61400-3 standard [69] is used to define the load cases, since it is commonly used internationally.<br />
All assumptions <strong>for</strong> external conditions are based on the UpWind <strong>design</strong> basis [55]. Only DLC 1.2 (normal<br />
operation) is taken into account, which is a major fatigue load case covering a significant part <strong>of</strong> the whole<br />
turbine lifetime. This is done <strong>for</strong> the following reason: the mean wind speeds over the turbine lifetime are<br />
well described with a Weibull distribution with the highest probability at approximately 10 m/s <strong>for</strong> the described<br />
<strong>of</strong>fshore site. Very high and very low wind speeds are there<strong>for</strong>e relatively rare. This means that a<br />
turbine with a realistic availability passes a large fraction <strong>of</strong> the total life time operating under conditions<br />
covered by this load case. Furthermore, the summed occurrence <strong>of</strong> all average wind speeds (10 min<br />
average) over Vave = 24m/s is only 73 hrs/yr, there<strong>for</strong>e these speeds are not taken into account. With the<br />
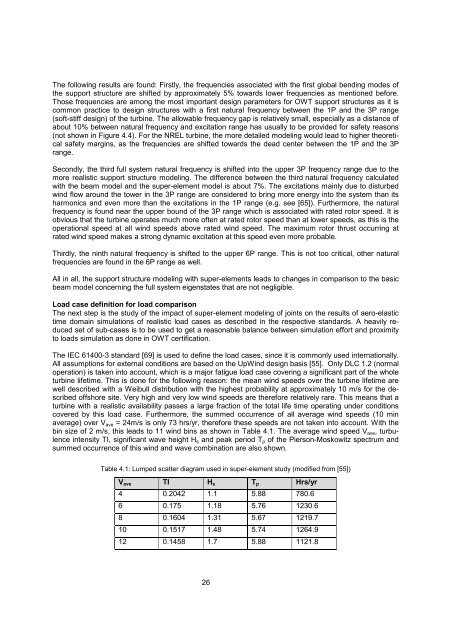
bin size <strong>of</strong> 2 m/s, this leads to 11 wind bins as shown in Table 4.1. The average wind speed Vave, turbulence<br />
intensity TI, significant wave height Hs and peak period Tp <strong>of</strong> the Pierson-Moskowitz spectrum and<br />
summed occurrence <strong>of</strong> this wind and wave combination are also shown.<br />
Table 4.1: Lumped scatter diagram used in super-element study (modified from [55])<br />
Vave TI Hs Tp Hrs/yr<br />
4 0.2042 1.1 5.88 780.6<br />
6 0.175 1.18 5.76 1230.6<br />
8 0.1604 1.31 5.67 1219.7<br />
10 0.1517 1.48 5.74 1264.9<br />
12 0.1458 1.7 5.88 1121.8<br />
26