Redesigning Animal Agriculture
Redesigning Animal Agriculture
Redesigning Animal Agriculture
Create successful ePaper yourself
Turn your PDF publications into a flip-book with our unique Google optimized e-Paper software.
164 G. Marion et al.<br />
250<br />
200<br />
150<br />
100<br />
50<br />
0<br />
0.0e+00<br />
9000<br />
8000<br />
7000<br />
6000<br />
5000<br />
4000<br />
3000<br />
2000<br />
1000<br />
0<br />
0.0e+00 2.0e+05 4.0e+05 6.0e+05 8.0e+05 1.0e+06<br />
mixing of the Markov chain by some alternative<br />
parameterization with respect to animal<br />
movement, it is difficult to see how this<br />
could be achieved without radically changing<br />
the model and whilst remaining faithful<br />
to the description of the underlying process.<br />
In addition, here we seek to develop a statistical<br />
treatment of an existing process-based<br />
model and demonstrate that progress can<br />
be made even with large amounts of missing<br />
data. However, it is clear that additional<br />
information on animal movements would<br />
greatly facilitate this analysis.<br />
The detection of avoidance behaviour<br />
was of key interest in terms of the original<br />
experiment (Friend et al., 2002), and the estimates<br />
of the avoidance parameter shown in<br />
Fig. 9.5 provide strong evidence that the animals<br />
are avoiding faecal contamination, with<br />
bite rates on contaminated patches being,<br />
2.0e+05 4.0e+05 6.0e+05 8.0e+05 1.0e+06<br />
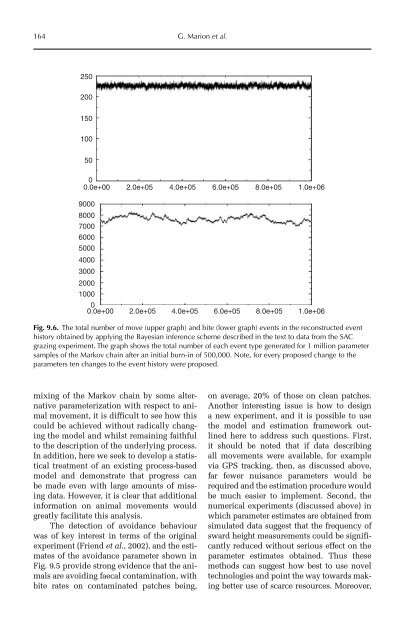
Fig. 9.6. The total number of move (upper graph) and bite (lower graph) events in the reconstructed event<br />
history obtained by applying the Bayesian inference scheme described in the text to data from the SAC<br />
grazing experiment. The graph shows the total number of each event type generated for 1 million parameter<br />
samples of the Markov chain after an initial burn-in of 500,000. Note, for every proposed change to the<br />
parameters ten changes to the event history were proposed.<br />
on average, 20% of those on clean patches.<br />
Another interesting issue is how to design<br />
a new experiment, and it is possible to use<br />
the model and estimation framework outlined<br />
here to address such questions. First,<br />
it should be noted that if data describing<br />
all movements were available, for example<br />
via GPS tracking, then, as discussed above,<br />
far fewer nuisance parameters would be<br />
required and the estimation procedure would<br />
be much easier to implement. Second, the<br />
numerical experiments (discussed above) in<br />
which parameter estimates are obtained from<br />
simulated data suggest that the frequency of<br />
sward height measurements could be significantly<br />
reduced without serious effect on the<br />
parameter estimates obtained. Thus these<br />
methods can suggest how best to use novel<br />
technologies and point the way towards making<br />
better use of scarce resources. Moreover,


