Redesigning Animal Agriculture
Redesigning Animal Agriculture
Redesigning Animal Agriculture

Create successful ePaper yourself
Turn your PDF publications into a flip-book with our unique Google optimized e-Paper software.
tions underlying the desirable phenotypes<br />
of various production, reproduction and<br />
adaptation traits. Although hundreds of<br />
QTL are map ped in livestock species, very<br />
few causative mutations are identified. One<br />
notable exception is that of the DGAT1 locus<br />
contributing to fat composition in milk followed<br />
by functional confirmation of the<br />
effect of a missense mutation (Grisart et al.,<br />
2002, 2004). These are termed as the quantitative<br />
trait nucleotides (QTN) signifying the<br />
actual nucleotide affecting the quantitative<br />
trait of interest.<br />
Another tool that needs to be exploited<br />
is the field of comparative genomics, or<br />
comparative analyses of genomes. This is<br />
one of the ways of dissecting the genetic<br />
basis of pheno typic variation across species.<br />
The power of this tool is enhanced by<br />
the availability of whole genome sequences<br />
for the livestock species. These comparative<br />
studies can direct research to species-specific<br />
chromosomal regions that could not be<br />
revealed by focusing on studying individual<br />
genomes. Womack (2005) remarked that<br />
identification of QTL for disease resistance<br />
in livestock is the next big frontier, leading<br />
to the understanding of host–pathogen<br />
interaction and subsequent improvement of<br />
both animal and human health. In the tropics,<br />
however, resistance not only to endemic<br />
diseases but also to natural tropical stressors<br />
such as ticks, endo-parasites and heat is<br />
Precision <strong>Animal</strong> Breeding 73<br />
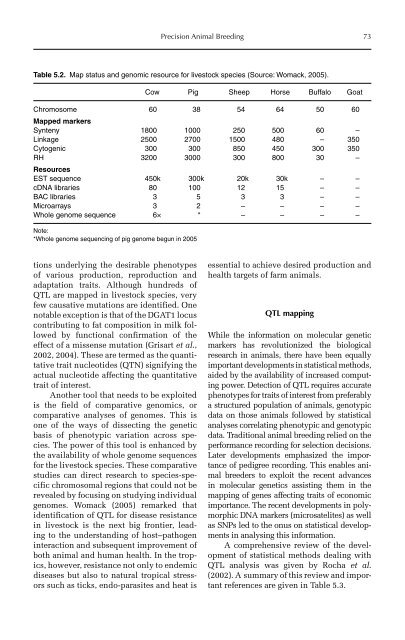
Table 5.2. Map status and genomic resource for livestock species (Source: Womack, 2005).<br />
Cow Pig Sheep Horse Buffalo Goat<br />
Chromosome<br />
Mapped markers<br />
60 38 54 64 50 60<br />
Synteny 1800 1000 250 500 60 –<br />
Linkage 2500 2700 1500 480 – 350<br />
Cytogenic 300 300 850 450 300 350<br />
RH<br />
Resources<br />
3200 3000 300 800 30 –<br />
EST sequence 450k 300k 20k 30k – –<br />
cDNA libraries 80 100 12 15 – –<br />
BAC libraries 3 5 3 3 – –<br />
Microarrays 3 2 – – – –<br />
Whole genome sequence 6× * – – – –<br />
Note:<br />
*Whole genome sequencing of pig genome begun in 2005<br />
essential to achieve desired production and<br />
health targets of farm animals.<br />
QTL mapping<br />
While the information on molecular genetic<br />
markers has revolutionized the biological<br />
research in animals, there have been equally<br />
important developments in statistical methods,<br />
aided by the availability of increased computing<br />
power. Detection of QTL requires accurate<br />
phenotypes for traits of interest from preferably<br />
a structured population of animals, genotypic<br />
data on those animals followed by statistical<br />
analyses correlating phenotypic and genotypic<br />
data. Traditional animal breeding relied on the<br />
performance recording for selection decisions.<br />
Later developments emphasized the importance<br />
of pedigree recording. This enables animal<br />
breeders to exploit the recent advances<br />
in molecular genetics assisting them in the<br />
mapping of genes affecting traits of economic<br />
importance. The recent developments in polymorphic<br />
DNA markers (microsatelites) as well<br />
as SNPs led to the onus on statistical developments<br />
in analysing this information.<br />
A comprehensive review of the development<br />
of statistical methods dealing with<br />
QTL analysis was given by Rocha et al.<br />
(2002). A summary of this review and important<br />
references are given in Table 5.3.