Redesigning Animal Agriculture
Redesigning Animal Agriculture
Redesigning Animal Agriculture

Create successful ePaper yourself
Turn your PDF publications into a flip-book with our unique Google optimized e-Paper software.
Quarterly flow weighted mean<br />
nitrate concentration (NO3−N mg l−1 )<br />
12<br />
10<br />
8<br />
6<br />
4<br />
2<br />
1930<br />
UK <strong>Agriculture</strong><br />
Act, 1947<br />
Second World<br />
War<br />
1940<br />
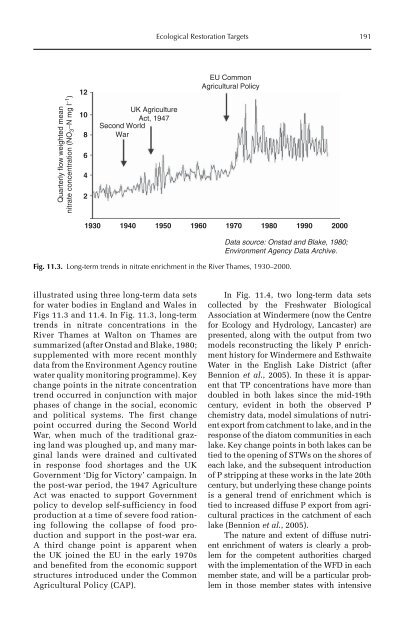
illustrated using three long-term data sets<br />
for water bodies in England and Wales in<br />
Figs 11.3 and 11.4. In Fig. 11.3, long-term<br />
trends in nitrate concentrations in the<br />
River Thames at Walton on Thames are<br />
summarized (after Onstad and Blake, 1980;<br />
supplemented with more recent monthly<br />
data from the Environment Agency routine<br />
water quality monitoring programme). Key<br />
change points in the nitrate concentration<br />
trend occurred in conjunction with major<br />
phases of change in the social, economic<br />
and political systems. The first change<br />
point occurred during the Second World<br />
War, when much of the traditional grazing<br />
land was ploughed up, and many marginal<br />
lands were drained and cultivated<br />
in response food shortages and the UK<br />
Government ‘Dig for Victory’ campaign. In<br />
the post-war period, the 1947 <strong>Agriculture</strong><br />
Act was enacted to support Government<br />
policy to develop self-sufficiency in food<br />
production at a time of severe food rationing<br />
following the collapse of food production<br />
and support in the post-war era.<br />
A third change point is apparent when<br />
the UK joined the EU in the early 1970s<br />
and benefited from the economic support<br />
structures introduced under the Common<br />
Agricultural Policy (CAP).<br />
Ecological Restoration Targets 191<br />
EU Common<br />
Agricultural Policy<br />
1950 1960 1970 1980 1990<br />
Data source: Onstad and Blake, 1980;<br />
Environment Agency Data Archive.<br />
Fig. 11.3. Long-term trends in nitrate enrichment in the River Thames, 1930–2000.<br />
2000<br />
In Fig. 11.4, two long-term data sets<br />
collected by the Freshwater Biological<br />
Association at Windermere (now the Centre<br />
for Ecology and Hydrology, Lancaster) are<br />
presented, along with the output from two<br />
models reconstructing the likely P enrichment<br />
history for Windermere and Esthwaite<br />
Water in the English Lake District (after<br />
Bennion et al., 2005). In these it is apparent<br />
that TP concentrations have more than<br />
doubled in both lakes since the mid-19th<br />
century, evident in both the observed P<br />
chemistry data, model simulations of nutrient<br />
export from catchment to lake, and in the<br />
response of the diatom communities in each<br />
lake. Key change points in both lakes can be<br />
tied to the opening of STWs on the shores of<br />
each lake, and the subsequent introduction<br />
of P stripping at these works in the late 20th<br />
century, but underlying these change points<br />
is a general trend of enrichment which is<br />
tied to increased diffuse P export from agricultural<br />
practices in the catchment of each<br />
lake (Bennion et al., 2005).<br />
The nature and extent of diffuse nutrient<br />
enrichment of waters is clearly a problem<br />
for the competent authorities charged<br />
with the implementation of the WFD in each<br />
member state, and will be a particular problem<br />
in those member states with intensive