

April 2012 Volume 15 Number 2 - Educational Technology & Society
April 2012 Volume 15 Number 2 - Educational Technology & Society
April 2012 Volume 15 Number 2 - Educational Technology & Society

You also want an ePaper? Increase the reach of your titles
YUMPU automatically turns print PDFs into web optimized ePapers that Google loves.
Experiment 2 and results<br />
In this experiment, the performance of nine adaptive testing algorithms, Diagnosys, Diagnosys+MDI, Diagnosys+PI,<br />
OT, OT+MDI, OT+PI, IRS, IRS+MDI, and IRS+PI, were evaluated by using the same data set as Experiment 1. The<br />
use of test items and prediction accuracy were obtained by five-fold cross-validation. Results were presented in<br />
Table 6. For example, in Table 6, when the threshold was 0.01, the prediction accuracy of Diagnosys,<br />
Diagnosys+MDI, and Diagnosys+PI were 0.956, 0.996, and 0.992, respectively, and their corresponding use of test<br />
items were 32.64, 34.70, and 34.53. A Wilcoxon-Signed-Ranks test was used to compare the performances among<br />
nine models (Table 7). In Table 7, “Diag+MDI to Diag” indicates that the performance between original Diagnosys<br />
and Diagnosys with MDI was compared. Due to different thresholds, the performance of Diag+MDI, OT+MDI, and<br />
IRS+MDI were not explored. The results are as follows.<br />
1. In Table 7, the results of the Wilcoxon-signed-ranks test revealed that Diagnosys, OT, and IRS, the prediction<br />
accuracies, adaptive testing algorithms with the most-difficult-item method (MDI) and prerequisite method (PI)<br />
both perform better than the original adaptive testing algorithms (z = −3.422 ~ −3.409, p = 0.001). Otherwise, in<br />
Diagnosys, Diagnosys+MDI outperform Diagnosys+PI (z = −3.4<strong>15</strong>, p = 0.001); in OT, OT+MDI outperform<br />
OT+PI (z = −3.066, p = 0.002); in IRS, IRS+MDI outperformed IRS+PI (z = −3.482, p = 0.000).Overall, the<br />
performance of adaptive testing algorithms with the most difficult item (MDI) method was better than that of<br />
adaptive testing algorithms with the prerequisite method (PI method).<br />
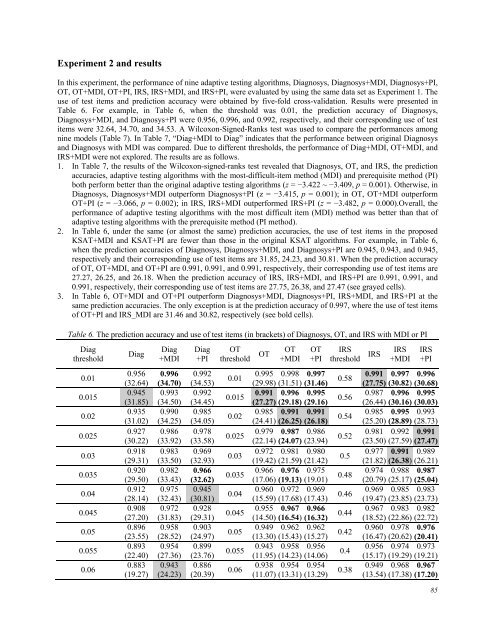
2. In Table 6, under the same (or almost the same) prediction accuracies, the use of test items in the proposed<br />
KSAT+MDI and KSAT+PI are fewer than those in the original KSAT algorithms. For example, in Table 6,<br />
when the prediction accuracies of Diagnosys, Diagnosys+MDI, and Diagnosys+PI are 0.945, 0.943, and 0.945,<br />
respectively and their corresponding use of test items are 31.85, 24.23, and 30.81. When the prediction accuracy<br />
of OT, OT+MDI, and OT+PI are 0.991, 0.991, and 0.991, respectively, their corresponding use of test items are<br />
27.27, 26.25, and 26.18. When the prediction accuracy of IRS, IRS+MDI, and IRS+PI are 0.991, 0.991, and<br />
0.991, respectively, their corresponding use of test items are 27.75, 26.38, and 27.47 (see grayed cells).<br />
3. In Table 6, OT+MDI and OT+PI outperform Diagnosys+MDI, Diagnosys+PI, IRS+MDI, and IRS+PI at the<br />
same prediction accuracies. The only exception is at the prediction accuracy of 0.997, where the use of test items<br />
of OT+PI and IRS_MDI are 31.46 and 30.82, respectively (see bold cells).<br />
Table 6. The prediction accuracy and use of test items (in brackets) of Diagnosys, OT, and IRS with MDI or PI<br />
Diag<br />
threshold<br />
0.01<br />
0.0<strong>15</strong><br />
0.02<br />
0.025<br />
0.03<br />
0.035<br />
0.04<br />
0.045<br />
0.05<br />
0.055<br />
0.06<br />
Diag<br />
0.956<br />
(32.64)<br />
0.945<br />
(31.85)<br />
0.935<br />
(31.02)<br />
0.927<br />
(30.22)<br />
0.918<br />
(29.31)<br />
0.920<br />
(29.50)<br />
0.912<br />
(28.14)<br />
0.908<br />
(27.20)<br />
0.896<br />
(23.55)<br />
0.893<br />
(22.40)<br />
0.883<br />
(19.27)<br />
Diag<br />
+MDI<br />
0.996<br />
(34.70)<br />
0.993<br />
(34.50)<br />
0.990<br />
(34.25)<br />
0.986<br />
(33.92)<br />
0.983<br />
(33.50)<br />
0.982<br />
(33.43)<br />
0.975<br />
(32.43)<br />
0.972<br />
(31.83)<br />
0.958<br />
(28.52)<br />
0.954<br />
(27.36)<br />
0.943<br />
(24.23)<br />
Diag<br />
+PI<br />
0.992<br />
(34.53)<br />
0.992<br />
(34.45)<br />
0.985<br />
(34.05)<br />
0.978<br />
(33.58)<br />
0.969<br />
(32.93)<br />
0.966<br />
(32.62)<br />
0.945<br />
(30.81)<br />
0.928<br />
(29.31)<br />
0.903<br />
(24.97)<br />
0.899<br />
(23.76)<br />
0.886<br />
(20.39)<br />
OT<br />
threshold OT<br />
0.01<br />
0.0<strong>15</strong><br />
0.02<br />
0.025<br />
0.03<br />
0.035<br />
0.04<br />
0.045<br />
0.05<br />
0.055<br />
0.06<br />
OT<br />
+MDI<br />
OT<br />
+PI<br />
0.995 0.998 0.997<br />
(29.98) (31.51) (31.46)<br />
0.991 0.996 0.995<br />
(27.27) (29.18) (29.16)<br />
0.985 0.991 0.991<br />
(24.41) (26.25) (26.18)<br />
0.979 0.987 0.986<br />
(22.14) (24.07) (23.94)<br />
0.972 0.981 0.980<br />
(19.42) (21.59) (21.42)<br />
0.966 0.976 0.975<br />
(17.06) (19.13) (19.01)<br />
0.960 0.972 0.969<br />
(<strong>15</strong>.59) (17.68) (17.43)<br />
0.955 0.967 0.966<br />
(14.50) (16.54) (16.32)<br />
0.949 0.962 0.962<br />
(13.30) (<strong>15</strong>.43) (<strong>15</strong>.27)<br />
0.943 0.958 0.956<br />
(11.95) (14.23) (14.06)<br />
0.938 0.954 0.954<br />
(11.07) (13.31) (13.29)<br />
IRS<br />
threshold<br />
0.58<br />
0.56<br />
0.54<br />
0.52<br />
0.5<br />
0.48<br />
0.46<br />
0.44<br />
0.42<br />
0.4<br />
0.38<br />
IRS<br />
IRS<br />
+MDI<br />
IRS<br />
+PI<br />
0.991 0.997 0.996<br />
(27.75) (30.82) (30.68)<br />
0.987 0.996 0.995<br />
(26.44) (30.16) (30.03)<br />
0.985 0.995 0.993<br />
(25.20) (28.89) (28.73)<br />
0.981 0.992 0.991<br />
(23.50) (27.59) (27.47)<br />
0.977 0.991 0.989<br />
(21.82) (26.38) (26.21)<br />
0.974 0.988 0.987<br />
(20.79) (25.17) (25.04)<br />
0.969 0.985 0.983<br />
(19.47) (23.85) (23.73)<br />
0.967 0.983 0.982<br />
(18.52) (22.86) (22.72)<br />
0.960 0.978 0.976<br />
(16.47) (20.62) (20.41)<br />
0.956 0.974 0.973<br />
(<strong>15</strong>.17) (19.29) (19.21)<br />
0.949 0.968 0.967<br />
(13.54) (17.38) (17.20)<br />
85


