Fütterungsbedingte mikrobielle Zusammensetzung von Rinderkot ...
Fütterungsbedingte mikrobielle Zusammensetzung von Rinderkot ...
Fütterungsbedingte mikrobielle Zusammensetzung von Rinderkot ...
You also want an ePaper? Increase the reach of your titles
YUMPU automatically turns print PDFs into web optimized ePapers that Google loves.
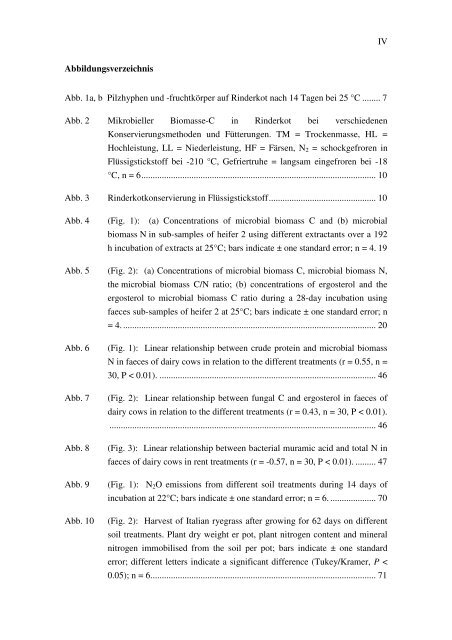
Abbildungsverzeichnis<br />
Abb. 1a, b Pilzhyphen und -fruchtkörper auf <strong>Rinderkot</strong> nach 14 Tagen bei 25 °C ........ 7<br />
Abb. 2 Mikrobieller Biomasse-C in <strong>Rinderkot</strong> bei verschiedenen<br />
Konservierungsmethoden und Fütterungen. TM = Trockenmasse, HL =<br />
Hochleistung, LL = Niederleistung, HF = Färsen, N2 = schockgefroren in<br />
Flüssigstickstoff bei -210 °C, Gefriertruhe = langsam eingefroren bei -18<br />
°C, n = 6 ....................................................................................................... 10<br />
Abb. 3 <strong>Rinderkot</strong>konservierung in Flüssigstickstoff ............................................... 10<br />
Abb. 4 (Fig. 1): (a) Concentrations of microbial biomass C and (b) microbial<br />
biomass N in sub-samples of heifer 2 using different extractants over a 192<br />
h incubation of extracts at 25°C; bars indicate ± one standard error; n = 4. 19<br />
Abb. 5 (Fig. 2): (a) Concentrations of microbial biomass C, microbial biomass N,<br />
the microbial biomass C/N ratio; (b) concentrations of ergosterol and the<br />
ergosterol to microbial biomass C ratio during a 28-day incubation using<br />
faeces sub-samples of heifer 2 at 25°C; bars indicate ± one standard error; n<br />
= 4. ............................................................................................................... 20<br />
Abb. 6 (Fig. 1): Linear relationship between crude protein and microbial biomass<br />
N in faeces of dairy cows in relation to the different treatments (r = 0.55, n =<br />
30, P < 0.01). ............................................................................................... 46<br />
Abb. 7 (Fig. 2): Linear relationship between fungal C and ergosterol in faeces of<br />
dairy cows in relation to the different treatments (r = 0.43, n = 30, P < 0.01).<br />
..................................................................................................................... 46<br />
Abb. 8 (Fig. 3): Linear relationship between bacterial muramic acid and total N in<br />
faeces of dairy cows in rent treatments (r = -0.57, n = 30, P < 0.01). ......... 47<br />
Abb. 9 (Fig. 1): N2O emissions from different soil treatments during 14 days of<br />
incubation at 22°C; bars indicate ± one standard error; n = 6. .................... 70<br />
Abb. 10 (Fig. 2): Harvest of Italian ryegrass after growing for 62 days on different<br />
soil treatments. Plant dry weight er pot, plant nitrogen content and mineral<br />
nitrogen immobilised from the soil per pot; bars indicate ± one standard<br />
error; different letters indicate a significant difference (Tukey/Kramer, P <<br />
0.05); n = 6. .................................................................................................. 71<br />
IV


