Maria Knobelsdorf, University of Dortmund, Germany - Didaktik der ...
Maria Knobelsdorf, University of Dortmund, Germany - Didaktik der ...
Maria Knobelsdorf, University of Dortmund, Germany - Didaktik der ...

You also want an ePaper? Increase the reach of your titles
YUMPU automatically turns print PDFs into web optimized ePapers that Google loves.
formatics. The final sample <strong>of</strong> respondents was comprised <strong>of</strong> 115<br />
Students. From the total <strong>of</strong> students, 55 (47.8%) attended the 3 rd<br />
<strong>of</strong> Greek Lyceum (16-17 years), 29 (25.2%) the 11 th or 12 th <strong>of</strong> a<br />
German Gymnasium (16-18 years) and 31 (27.0%) the first year<br />
<strong>of</strong> study at the Department <strong>of</strong> Informatics (17-18 years). 88 <strong>of</strong> the<br />
students were males (76.5%) and 27 (23.5%) females.<br />
4.2 Data Analysis and Results<br />
As proposed by Fornell and Larcker [9], there are three procedures<br />
to assess the convergent validity <strong>of</strong> any measure in a study:<br />
1) Composite reliability <strong>of</strong> each construct, 2) Item reliability <strong>of</strong><br />
the measure and 3) The average variance extracted (AVE).<br />
Therefore, we started with an analysis <strong>of</strong> composite reliability and<br />
dimensionality to check the validity <strong>of</strong> the scale used in the questionnaire.<br />
Concerning the reliability <strong>of</strong> the scales, Cronbach (CR)<br />
α indicator was applied [7] and inter-item correlations statistics<br />
for the items <strong>of</strong> the variable were calculated. As stated by to Fornell<br />
& Larcker [9], CR α value greater than 0.7 indicates a high<br />
reliability. Table 1 demonstrates the result <strong>of</strong> the test that revealed<br />
acceptable indices <strong>of</strong> internal consistency in all the factors.<br />
Table 1. Summary <strong>of</strong> Measurement Scales<br />
Factors Items Mean S.D. CR Loads AVE<br />
PE PE1 4.52 1.95 0.93 0.74 0.67<br />
PE2 4.16 1.75 0.85<br />
PE3 4.40 1.72 0.84<br />
PE4 4.51 1.69 0.83<br />
STF STF1 4.97 1.51 0.92 0.72 0.62<br />
STF2 4.98 1.58 0.73<br />
STF3 5.47 1.61 0.86<br />
STF4 5.23 1.68 0.82<br />
SI SN1 4.04 2.00 0.82 0.76 0.63<br />
SN2 4.12 2.04 0.82<br />
SEF SEF1 3.89 1.79 0.71 0.82 0.56<br />
SEF2 4.19 1.73 0.70<br />
SEF3 2.62 1.69 0.72<br />
BI BI1 4.90 2.09 0.96 0.82 0.73<br />
BI2 4.87 2.03 0.87<br />
BI3 4.36 2.07 0.88<br />
CPS CPS1 4.88 1.46 0.88 0.76 0.54<br />
CPS2 4.89 1.44 0.75<br />
CPS3 4.79 1.57 0.83<br />
CPS4 4.36 1.62 0.58<br />
C(CL)C CCC1 5.31 1.69 0.91 0.61 0.53<br />
CCC2 5.13 1.60 0.85<br />
CCC3 4.84 1.76 0.62<br />
CLC1 5.50 1.59 0.71<br />
CLC2 5.11 1.58 0.77<br />
CLC3 5.03 1.55 0.78<br />
CDS CDS1 4.74 1.68 0.90 0.80 0.59<br />
CDS2 4.44 2.03 0.83<br />
CDS3 4.82 1.84 0.82<br />
CDS4 4.48 1.97 0.75<br />
CDS5 4.07 1.92 0.63<br />
The reliability <strong>of</strong> an item was assessed by measuring its factor<br />
loading onto the un<strong>der</strong>lying construct. Hair et al. [12] recommended<br />
a factor loading <strong>of</strong> 0.5 to be good indicator <strong>of</strong> validity at<br />
the item level. The factor analysis identified eight distinct factors<br />
(Table 1): 1) Performance Expectancy (PE), 2) Satisfaction (STF),<br />
3) Social Influence (SI), 4) Self-Efficacy (SEF), 5) Behavioral<br />
Intention (BI), 6) Confidence with Problem Solving (CPS), 7)<br />
Confidence for using Data Commands (Conditional-Loop)<br />
(C(CL)C) and 8) Confidence for Data Structures (CDS).<br />
The third step for assessing the convergent validity is the average<br />
variance extracted (AVE); AVE measures the overall amount <strong>of</strong><br />
22<br />
variance that is attributed to the construct in relation to the amount<br />
<strong>of</strong> variance attributable to measurement error. Convergent validity<br />
is found to be adequate when the average variance extracted is<br />
equal or exceeds 0.50 [16].<br />
To examine the research questions regarding the differences in<br />
students’ perceptions among German Gymnasium, and CS freshmen,<br />
we used an Analysis <strong>of</strong> Variances (ANOVA), including the<br />
eight factors as dependent variables and the students’ group as<br />
independent variable. As we can see from the outcome data in<br />
Table 2, students’ group has a significant impact on students’ PE,<br />
STF, SI, BI and CDS. On the other hand students’ group does not<br />
exhibit significant difference on students’ SEF, CPS and C(CL)C.<br />
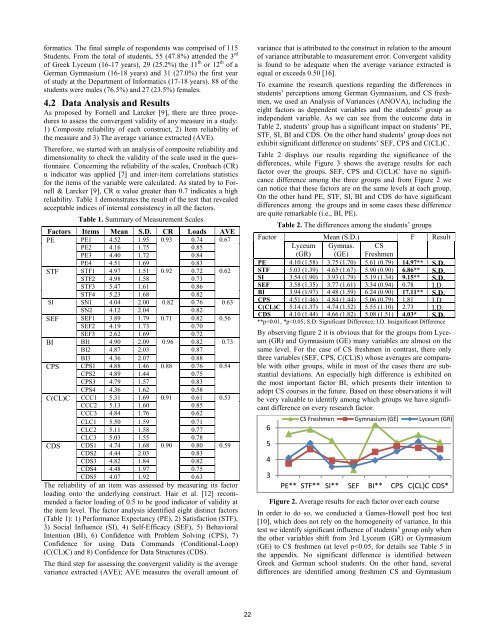
Table 2 displays our results regarding the significance <strong>of</strong> the<br />
differences, while Figure 3 shows the average results for each<br />
factor over the groups. SEF, CPS and C(CL)C have no significance<br />
difference among the three groups and from Figure 2 we<br />
can notice that these factors are on the same levels at each group.<br />
On the other hand PE, STF, SI, BI and CDS do have significant<br />
differences among the groups and in some cases these difference<br />
are quite remarkable (i.e., BI, PE).<br />
Table 2. The differences among the students’ groups<br />
Factor Mean (S.D.) F Result<br />
Lyceum Gymnas. CS<br />
(GR) (GE) Freshmen<br />
PE 4.10 (1.58) 3.75 (1.70) 5.61 (0.79) 14.97** S.D.<br />
STF<br />
SI<br />
5.03 (1.39)<br />
3.54 (1.90)<br />
4.65 (1.67)<br />
3.93 (1.79)<br />
5.90 (0.90)<br />
5.19 (1.34)<br />
6.86**<br />
9.15**<br />
S.D.<br />
S.D.<br />
SEF 3.58 (1.35) 3.77 (1.61) 3.34 (0.94) 0.78 I.D.<br />
BI 3.94 (1.97) 4.48 (1.59) 6.24 (0.90) 17.11** S.D.<br />
CPS 4.51 (1.46) 4.84 (1.44) 5.06 (0.79) 1.81 I.D.<br />
C(CL)C 5.14 (1.37) 4.74 (1.52) 5.55 (1.10) 2.73 I.D.<br />
CDS 4.10 (1.44) 4.66 (1.82) 5.08 (1.51) 4.03* S.D.<br />
**p