Maria Knobelsdorf, University of Dortmund, Germany - Didaktik der ...
Maria Knobelsdorf, University of Dortmund, Germany - Didaktik der ...
Maria Knobelsdorf, University of Dortmund, Germany - Didaktik der ...

Create successful ePaper yourself
Turn your PDF publications into a flip-book with our unique Google optimized e-Paper software.
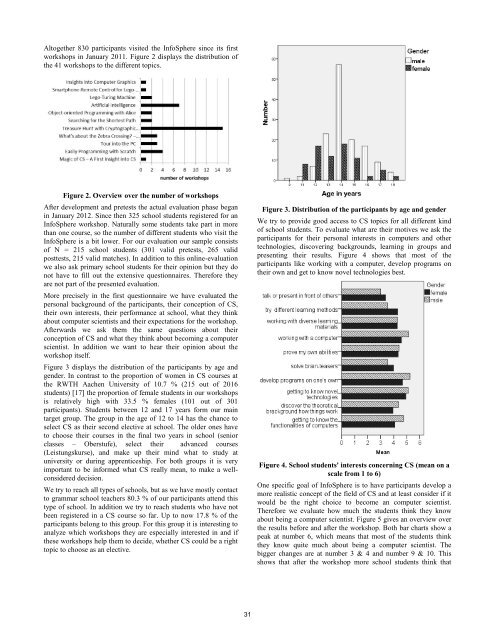
Altogether 830 participants visited the InfoSphere since its first<br />
workshops in January 2011. Figure 2 displays the distribution <strong>of</strong><br />
the 41 workshops to the different topics.<br />
Figure 2. Overview over the number <strong>of</strong> workshops<br />
After development and pretests the actual evaluation phase began<br />
in January 2012. Since then 325 school students registered for an<br />
InfoSphere workshop. Naturally some students take part in more<br />
than one course, so the number <strong>of</strong> different students who visit the<br />
InfoSphere is a bit lower. For our evaluation our sample consists<br />
<strong>of</strong> N = 215 school students (301 valid pretests, 265 valid<br />
posttests, 215 valid matches). In addition to this online-evaluation<br />
we also ask primary school students for their opinion but they do<br />
not have to fill out the extensive questionnaires. Therefore they<br />
are not part <strong>of</strong> the presented evaluation.<br />
More precisely in the first questionnaire we have evaluated the<br />
personal background <strong>of</strong> the participants, their conception <strong>of</strong> CS,<br />
their own interests, their performance at school, what they think<br />
about computer scientists and their expectations for the workshop.<br />
Afterwards we ask them the same questions about their<br />
conception <strong>of</strong> CS and what they think about becoming a computer<br />
scientist. In addition we want to hear their opinion about the<br />
workshop itself.<br />
Figure 3 displays the distribution <strong>of</strong> the participants by age and<br />
gen<strong>der</strong>. In contrast to the proportion <strong>of</strong> women in CS courses at<br />
the RWTH Aachen <strong>University</strong> <strong>of</strong> 10.7 % (215 out <strong>of</strong> 2016<br />
students) [17] the proportion <strong>of</strong> female students in our workshops<br />
is relatively high with 33.5 % females (101 out <strong>of</strong> 301<br />
participants). Students between 12 and 17 years form our main<br />
target group. The group in the age <strong>of</strong> 12 to 14 has the chance to<br />
select CS as their second elective at school. The ol<strong>der</strong> ones have<br />
to choose their courses in the final two years in school (senior<br />
classes – Oberstufe), select their advanced courses<br />
(Leistungskurse), and make up their mind what to study at<br />
university or during apprenticeship. For both groups it is very<br />
important to be informed what CS really mean, to make a wellconsi<strong>der</strong>ed<br />
decision.<br />
We try to reach all types <strong>of</strong> schools, but as we have mostly contact<br />
to grammar school teachers 80.3 % <strong>of</strong> our participants attend this<br />
type <strong>of</strong> school. In addition we try to reach students who have not<br />
been registered in a CS course so far. Up to now 17.8 % <strong>of</strong> the<br />
participants belong to this group. For this group it is interesting to<br />
analyze which workshops they are especially interested in and if<br />
these workshops help them to decide, whether CS could be a right<br />
topic to choose as an elective.<br />
31<br />
Figure 3. Distribution <strong>of</strong> the participants by age and gen<strong>der</strong><br />
We try to provide good access to CS topics for all different kind<br />
<strong>of</strong> school students. To evaluate what are their motives we ask the<br />
participants for their personal interests in computers and other<br />
technologies, discovering backgrounds, learning in groups and<br />
presenting their results. Figure 4 shows that most <strong>of</strong> the<br />
participants like working with a computer, develop programs on<br />
their own and get to know novel technologies best.<br />
Figure 4. School students' interests concerning CS (mean on a<br />
scale from 1 to 6)<br />
One specific goal <strong>of</strong> InfoSphere is to have participants develop a<br />
more realistic concept <strong>of</strong> the field <strong>of</strong> CS and at least consi<strong>der</strong> if it<br />
would be the right choice to become an computer scientist.<br />
Therefore we evaluate how much the students think they know<br />
about being a computer scientist. Figure 5 gives an overview over<br />
the results before and after the workshop. Both bar charts show a<br />
peak at number 6, which means that most <strong>of</strong> the students think<br />
they know quite much about being a computer scientist. The<br />
bigger changes are at number 3 & 4 and number 9 & 10. This<br />
shows that after the workshop more school students think that