Maria Knobelsdorf, University of Dortmund, Germany - Didaktik der ...
Maria Knobelsdorf, University of Dortmund, Germany - Didaktik der ...
Maria Knobelsdorf, University of Dortmund, Germany - Didaktik der ...

Create successful ePaper yourself
Turn your PDF publications into a flip-book with our unique Google optimized e-Paper software.
characteristics mean m<br />
(regarding the<br />
data<br />
boys)<br />
<strong>of</strong> the<br />
interest in Informatics t0: 3.79<br />
t1: 3.65<br />
self-concept <strong>of</strong> ability in In- t0: 3.82<br />
formatics<br />
t1: 4.10<br />
vocational orientation t0: 4.07<br />
t1: 4.00<br />
difference mean m<br />
m1-m0 (regarding the<br />
data<br />
girls)<br />
<strong>of</strong> the<br />
-0.14 t0: 2.92<br />
t1: 3.36<br />
+0.28 t0: 3.11<br />
t1: 3.35<br />
-0.07 t0: 2.95<br />
t1: 3.44<br />
difference StdDev<br />
m1-m0 (regarding the<br />
data<br />
boys)<br />
<strong>of</strong> the<br />
+0.44 t0: 0.80<br />
t1: 1.08<br />
+0.24 t0: 1.08<br />
t1: 0.97<br />
+0.49 t0: 1.17<br />
t1: 1.24<br />
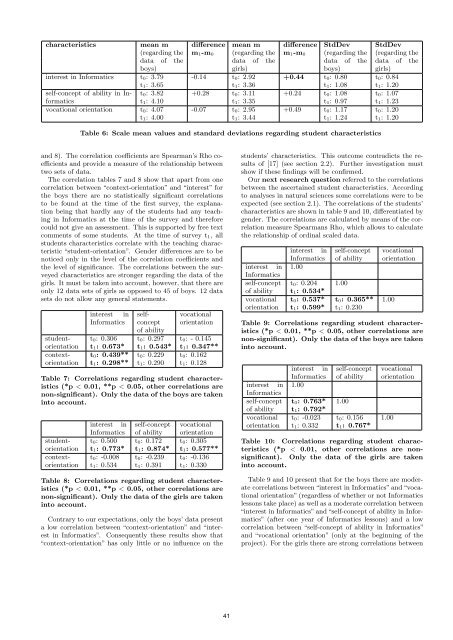
Table 6: Scale mean values and standard deviations regarding student characteristics<br />
and 8). The correlation coefficients are Spearman’s Rho coefficients<br />
and provide a measure <strong>of</strong> the relationship between<br />
two sets <strong>of</strong> data.<br />
The correlation tables 7 and 8 show that apart from one<br />
correlation between “context-orientation” and “interest” for<br />
the boys there are no statistically significant correlations<br />
to be found at the time <strong>of</strong> the first survey, the explanation<br />
being that hardly any <strong>of</strong> the students had any teaching<br />
in Informatics at the time <strong>of</strong> the survey and therefore<br />
could not give an assessment. This is supported by free text<br />
comments <strong>of</strong> some students. At the time <strong>of</strong> survey t1, all<br />
students characteristics correlate with the teaching characteristic<br />
“student-orientation”. Gen<strong>der</strong> differences are to be<br />
noticed only in the level <strong>of</strong> the correlation coefficients and<br />
the level <strong>of</strong> significance. The correlations between the surveyed<br />
characteristics are stronger regarding the data <strong>of</strong> the<br />
girls. It must be taken into account, however, that there are<br />
only 12 data sets <strong>of</strong> girls as opposed to 45 <strong>of</strong> boys. 12 data<br />
sets do not allow any general statements.<br />
studentorientationcontextorientation<br />
interest in<br />
Informatics<br />
t0: 0.306<br />
t1: 0.673*<br />
t0: 0.439**<br />
t1: 0.298**<br />
selfconcept<br />
<strong>of</strong> ability<br />
t0: 0.297<br />
t1: 0.543*<br />
t0: 0.229<br />
t1: 0.290<br />
vocational<br />
orientation<br />
t0: - 0.145<br />
t1: 0.347**<br />
t0: 0.162<br />
t1: 0.128<br />
Table 7: Correlations regarding student characteristics<br />
(*p < 0.01, **p < 0.05, other correlations are<br />
non-significant). Only the data <strong>of</strong> the boys are taken<br />
into account.<br />
studentorientationcontextorientation<br />
interest in<br />
Informatics<br />
t0: 0.500<br />
t1: 0.773*<br />
t0: -0.008<br />
t1: 0.534<br />
self-concept<br />
<strong>of</strong> ability<br />
t0: 0.172<br />
t1: 0.874*<br />
t0: -0.239<br />
t1: 0.391<br />
vocational<br />
orientation<br />
t0: 0.305<br />
t1: 0.577**<br />
t0: -0.136<br />
t1: 0.330<br />
Table 8: Correlations regarding student characteristics<br />
(*p < 0.01, **p < 0.05, other correlations are<br />
non-significant). Only the data <strong>of</strong> the girls are taken<br />
into account.<br />
Contrary to our expectations, only the boys’ data present<br />
a low correlation between “context-orientation” and “interest<br />
in Informatics”. Consequently these results show that<br />
“context-orientation” has only little or no influence on the<br />
41<br />
StdDev<br />
(regarding the<br />
data <strong>of</strong> the<br />
girls)<br />
t0: 0.84<br />
t1: 1.20<br />
t0: 1.07<br />
t1: 1.23<br />
t0: 1.20<br />
t1: 1.20<br />
students’ characteristics. This outcome contradicts the results<br />
<strong>of</strong> [17] (see section 2.2). Further investigation must<br />
show if these findings will be confirmed.<br />
Our next research question referred to the correlations<br />
between the ascertained student characteristics. According<br />
to analyses in natural sciences some correlations were to be<br />
expected (see section 2.1). The correlations <strong>of</strong> the students’<br />
characteristics are shown in table 9 and 10, differentiated by<br />
gen<strong>der</strong>. The correlations are calculated by means <strong>of</strong> the correlation<br />
measure Spearmans Rho, which allows to calculate<br />
the relationship <strong>of</strong> ordinal scaled data.<br />
interest in<br />
Informatics<br />
self-concept<br />
<strong>of</strong> ability<br />
vocational<br />
orientation<br />
interest in<br />
Informatics<br />
1.00<br />
t0: 0.204<br />
t1: 0.534*<br />
t0: 0.537*<br />
t1: 0.599*<br />
self-concept<br />
<strong>of</strong> ability<br />
1.00<br />
t0: 0.365**<br />
t1: 0.230<br />
vocational<br />
orientation<br />
1.00<br />
Table 9: Correlations regarding student characteristics<br />
(*p < 0.01, **p < 0.05, other correlations are<br />
non-significant). Only the data <strong>of</strong> the boys are taken<br />
into account.<br />
interest in<br />
Informatics<br />
self-concept<br />
<strong>of</strong> ability<br />
vocational<br />
orientation<br />
interest in<br />
Informatics<br />
1.00<br />
t0: 0.763*<br />
t1: 0.792*<br />
t0: -0.023<br />
t1: 0.332<br />
self-concept<br />
<strong>of</strong> ability<br />
1.00<br />
t0: 0.156<br />
t1: 0.767*<br />
vocational<br />
orientation<br />
1.00<br />
Table 10: Correlations regarding student characteristics<br />
(*p < 0.01, other correlations are nonsignificant).<br />
Only the data <strong>of</strong> the girls are taken<br />
into account.<br />
Table 9 and 10 present that for the boys there are mo<strong>der</strong>ate<br />
correlations between “interest in Informatics” and “vocational<br />
orientation” (regardless <strong>of</strong> whether or not Informatics<br />
lessons take place) as well as a mo<strong>der</strong>ate correlation between<br />
“interest in Informatics” and “self-concept <strong>of</strong> ability in Informatics”<br />
(after one year <strong>of</strong> Informatics lessons) and a low<br />
correlation between “self-concept <strong>of</strong> ability in Informatics”<br />
and “vocational orientation” (only at the beginning <strong>of</strong> the<br />
project). For the girls there are strong correlations between