- Page 1 and 2:
MODELLING THE IMPACT OF URBANISATIO
- Page 3 and 4:
Abstract Urban areas have well docu
- Page 5 and 6:
Abbreviations aLMo Meteo Swiss oper
- Page 7 and 8:
4.2.2 Impact of the urban area on t
- Page 9 and 10:
List of figures Figure 2.1: Scales
- Page 11 and 12:
Figure 4.21: Diurnal variation of t
- Page 13 and 14:
Figure 6.16: Mean horizontal wind s
- Page 15 and 16:
Chapter 1: Introduction Urban areas
- Page 17 and 18:
with trends derived from a statisti
- Page 19 and 20:
scheme, and therefore it was necess
- Page 21 and 22:
The effects of future urban expansi
- Page 23 and 24:
2.1 Urban climate modification Urba
- Page 25 and 26:
latitudes (Taha 1997), and this is
- Page 27 and 28:
100 - 200 m 1 - 2 km 10 - 20 km 100
- Page 29 and 30:
epresentatively sample the underlyi
- Page 31 and 32:
over the city centre, convergent fl
- Page 33 and 34:
Cold islands can also occur in urba
- Page 35 and 36:
of the atmosphere. For example, it
- Page 37 and 38:
amount of solar radiation absorbed
- Page 39 and 40:
(Peterson 1969; Changnon 1992; Coll
- Page 41 and 42:
2.3 Justification of modelling appr
- Page 43 and 44:
Trusilova (2006) carried out a stud
- Page 45 and 46:
constant flux surface layer in the
- Page 47 and 48:
the vertical distribution of vegeta
- Page 49 and 50:
using different building parameters
- Page 51 and 52:
Table 2.2: SWOT analysis for the ME
- Page 53 and 54:
Fraction of urban land cover [%] Fi
- Page 55 and 56:
The built up area of London can cur
- Page 57 and 58:
Figure 2.5(a-f): Builtup area of Lo
- Page 59 and 60:
• Mainly high density development
- Page 61 and 62:
climate of London, and currently on
- Page 63 and 64:
For mid-latitude cities, of which L
- Page 65 and 66:
warming of 0.04 °C per decade, in
- Page 67 and 68:
out differences in the urban heat i
- Page 69 and 70:
adopted in previous studies ranges
- Page 71 and 72:
y the implementation of a specific
- Page 73 and 74:
A prognostic equation is used to re
- Page 75 and 76:
At the surface the temperature is c
- Page 77 and 78:
The boundary conditions used for th
- Page 79 and 80:
are defined in the file m1tini_TAPE
- Page 81 and 82:
The terms representing the impact o
- Page 83 and 84:
3.2.1 Calculation of dynamical effe
- Page 85 and 86:
θ k ∆z / 2 H Siu (Equation 3.12)
- Page 87 and 88:
3.3 Implementation of BEP in METRAS
- Page 89 and 90:
difficulties in the linking of the
- Page 91 and 92:
Table 3.3: Description of how the 2
- Page 93 and 94:
3.5.2 Orography data Orography data
- Page 95 and 96:
epresenting suburban development a
- Page 97 and 98:
Table 3.7 shows a summary of the MI
- Page 99 and 100:
3.6 Summary In this PhD study the m
- Page 101 and 102:
temperature, air pressure and air d
- Page 103 and 104:
Potential temperature [K] Figure 4.
- Page 105 and 106:
Wind speed [ms -1 ] Figure 4.2: Ver
- Page 107 and 108:
4.2.1 Horizontal cross sections of
- Page 109 and 110:
affected, as the flow bends around
- Page 111 and 112:
Downwind of the city on the other h
- Page 113 and 114:
the city, which is expected since t
- Page 115 and 116:
Potential temperature [K] Figure 4.
- Page 117 and 118:
simulation this effect is verticall
- Page 119 and 120:
differences are expected during day
- Page 121 and 122:
tend to cool the surface, but can a
- Page 123 and 124:
Figure 4.15 shows the vertical prof
- Page 125 and 126:
appropriate value for these paramet
- Page 127 and 128:
0.61) and that of conventional grav
- Page 129 and 130:
Difference in potential temperature
- Page 131 and 132:
educed near surface temperatures of
- Page 133 and 134:
fraction was increased in steps of
- Page 135 and 136:
works. In the control simulation th
- Page 137 and 138:
characterised by the albedo, therma
- Page 139 and 140:
is higher by a similar amount. The
- Page 141 and 142:
(a) Potential temperature [K] (c) T
- Page 143 and 144:
Figure 4.25 shows the vertical sect
- Page 145 and 146:
tests also reproduced well document
- Page 147 and 148:
Chapter 5: Evaluation of the urbani
- Page 149 and 150:
Fraction of urban land cover [%] Fi
- Page 151 and 152:
For the summers of 1995-2000 the an
- Page 153 and 154:
Table 5.2: Selected periods of simu
- Page 155 and 156:
commonly used as a rural reference
- Page 157 and 158: newly urbanised version of the METR
- Page 159 and 160: adiation trapping in the street can
- Page 161 and 162: the second day of simulation (31 st
- Page 163 and 164: Air temperature ( o C) 35 30 25 20
- Page 165 and 166: the model. The smaller percentage o
- Page 167 and 168: Wind speed (ms -1 ) Wind direction
- Page 169 and 170: London Heathrow Airport (LHR) Wind
- Page 171 and 172: A full set of hourly wind speed and
- Page 173 and 174: contain both roofs exposed to direc
- Page 175 and 176: Chapter 6: The effects of urban lan
- Page 177 and 178: simulations with two hypothetical s
- Page 179 and 180: dependent on the r(i,j), the radial
- Page 181 and 182: centre of the domain was more than
- Page 183 and 184: 6.2 Effects of the current state of
- Page 185 and 186: During daytime the shape of the are
- Page 187 and 188: The calculation was performed for t
- Page 189 and 190: ecause finding a rural reference po
- Page 191 and 192: development (GLA 2006) and differen
- Page 193 and 194: 6.2.4 Wind speed and direction Klai
- Page 195 and 196: Wind speed and direction (ms -1 ) F
- Page 197 and 198: “urban” cells to be affected by
- Page 199 and 200: the urban surface. Many other studi
- Page 201 and 202: eason the near surface potential te
- Page 203 and 204: Mean potential temperature at 12:00
- Page 205 and 206: where A(x) is the area affected by
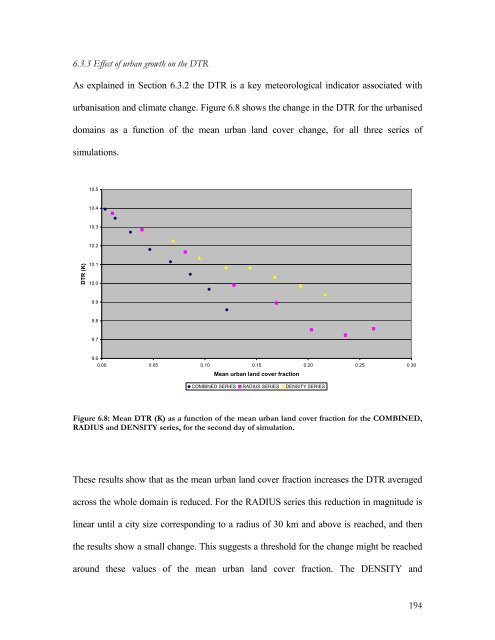
- Page 207: Table 6.8: REI for the RADIUS, DENS
- Page 211 and 212: for all runs in the series, and cor
- Page 213 and 214: The runs are then combined into one
- Page 215 and 216: to be more linear than the smaller
- Page 217 and 218: The total reduction in mean wind sp
- Page 219 and 220: The REI showed that for all the var
- Page 221 and 222: Higher temperatures in the urban ar
- Page 223 and 224: Over the next ten years the populat
- Page 225 and 226: 7.1.1 EXPANSION series The first sc
- Page 227 and 228: Another cause of this form of expan
- Page 229 and 230: 7.2 Effects of urbanisation for the
- Page 231 and 232: Mean near surface potential tempera
- Page 233 and 234: UHI intensity (K) 4 3.5 3 2.5 2 1.5
- Page 235 and 236: temperature, an increase in the mea
- Page 237 and 238: 7.2.3 Wind speed The effect of the
- Page 239 and 240: 7.3 Effects of urbanisation for the
- Page 241 and 242: mean near surface potential tempera
- Page 243 and 244: 7.3.2 Wind speed Changes in the mea
- Page 245 and 246: expansion strategies such as the re
- Page 247 and 248: should also be considered to avoid
- Page 249 and 250: models, for example Martilli et al.
- Page 251 and 252: cities (Baker et al. 2002). Already
- Page 253 and 254: uses, painting the roofs white to r
- Page 255 and 256: The full influence of different met
- Page 257 and 258: References Abercrombie, P. (1945).
- Page 259 and 260:
Bottema, M. (1997). "Urban Roughnes
- Page 261 and 262:
Craig, K. J. and R. D. Bornstein (2
- Page 263 and 264:
Grimmond, C. S. B. and T. R. Oke (2
- Page 265 and 266:
Jin, M. and J. M. Shepherd (2005).
- Page 267 and 268:
Lemonsu, A. and V. Masson (2002). "
- Page 269 and 270:
Nitis, T., Z. B. Klaic and N. Mouss
- Page 271 and 272:
alance in urban areas - Recent adva
- Page 273 and 274:
Seaman, N. L. (2000). "Meteorologic
- Page 275 and 276:
Therry, G. and P. Lacarrere (1983).
- Page 277:
Yague, C., E. Zurita and A. Martine


